Figure 6.
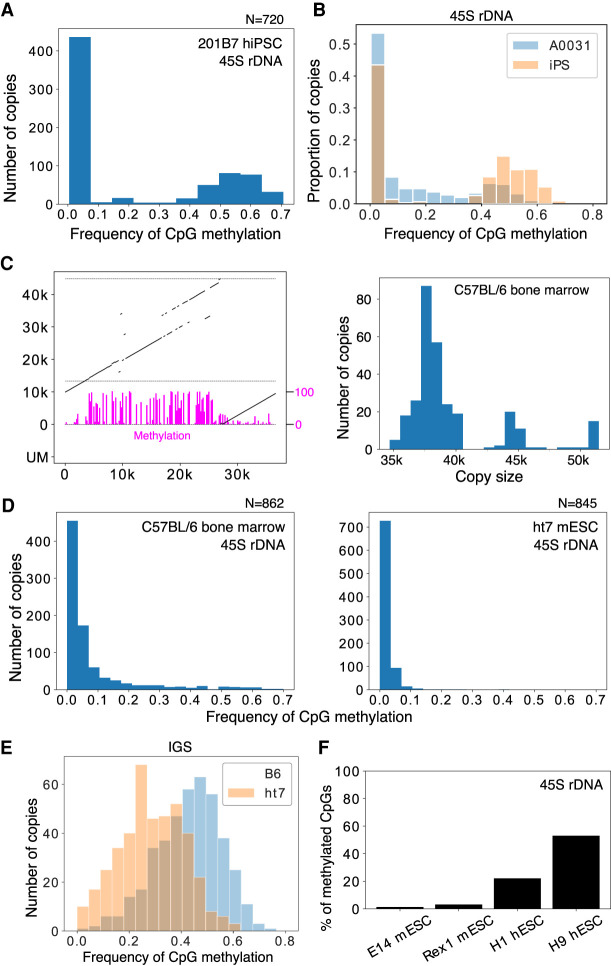
rDNA methylation in pluripotent stem cells. (A) The 45S rDNA methylation status of rDNA in hiPSCs does not differ from that in other differentiated samples: ∼40% of the transcribed region is methylated. (B) Comparison of the 45S rDNA methylation status in Werner syndrome patient fibroblasts (A0031) and iPSCs derived from them. The y-axis is the proportion of reads in each bin. The frequency of methylated copies is increased in iPSCs. (C) Representative rDNA from a Cas9-enriched Nanopore read of a mouse sample (left). Magenta bars represent CpG methylation. The estimated size distribution of mouse rDNA copies in C57BL/6 bone marrow cells is shown on the right. The rDNA copy size of mouse is much smaller than previously reported. (D) 45S rDNA methylation levels in B6 bone marrow cells and ht7 mESCs. Methylation levels among copies are more continuous in mice, and almost no methylation is seen in mESCs. (E) Comparison of IGS methylation levels in B6 bone marrow cells and ht7 mESCs. ht7 clearly shows a lower methylation level, even in the IGS region. (F) Proportion of CpGs methylated in the 45S rDNA of mESCs and hESCs determined by using publicly available short-read bisulfite whole-genome sequencing data. Although both samples of mESCs show a very low level of methylation, a substantial proportion of CpGs are methylated in hESCs.

