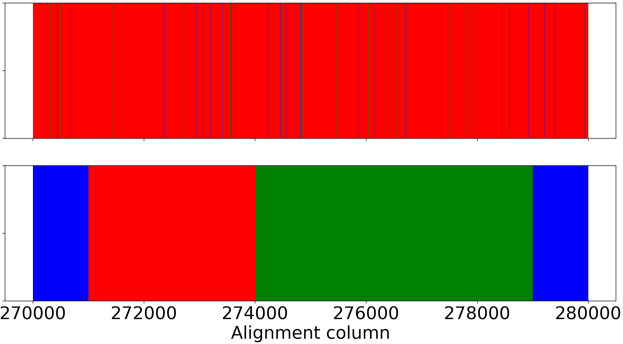
Figure 8.
Comparison of VICAR local genealogy inference with RAxML trees. RAxML was run on nonoverlapping sliding windows each of 1000 sites. The upper panel shows the topology of the local genealogy at each site inferred by VICAR. The lower panel shows the topology inferred by RAxML at each window. Coloring corresponds to different topologies: red corresponds to ((H. cydno, H. timareta), H. numata), which is also the topology of the species tree; blue, ((H. cydno, H. numata), H. timareta); and green, ((H. numata, H. timareta), H. cydno).

