Figure 4.
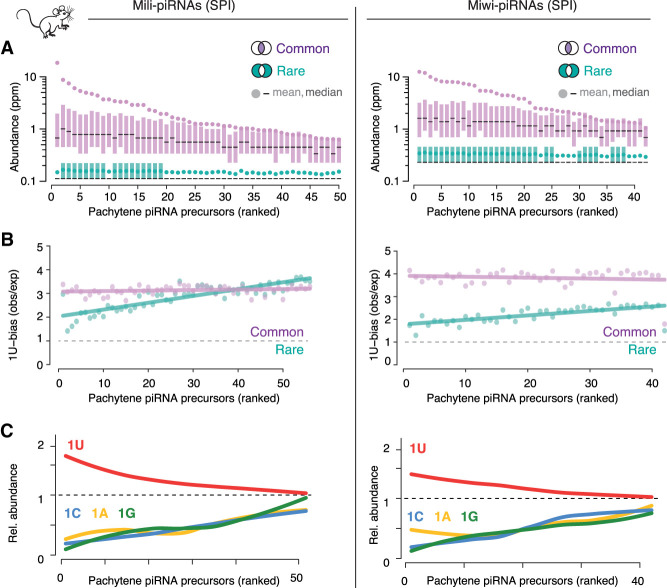
Precursor and processing preferences determine piRNA sequence abundance in mice. (A) piRNA precursors can be ranked by the mean sequence abundance of common piRNAs. All precursors, even top-ranked ones, also produced rare piRNAs. The sequence abundance of common and rare piRNAs associated with Mili or Miwi in primary spermatocytes (SPI) is shown for individual pachytene piRNA precursors (mean, median, 25th–75th percentile; n = 2). Publicly available source data: BioProject: PRJNA421205. (B) Common piRNAs have a stronger 1U-bias than rare piRNAs from the same precursor. The bias for uridine (1U-bias) in the first position—observed over expected 1U frequencies (obs/exp)—of Miwi- and Mili-piRNAs is shown for common and rare sequences from individual pachytene piRNA precursors (precursors are ranked as in A). (C) Uridine in the first position (1U) is indicative of higher sequence abundance. The mean abundance of piRNAs that start with a uridine (1U) was compared to that of piRNAs that start with either adenosine (1A), guanosine (1G), or cytidine (1C). The mean abundance of 1U-, 1A-, 1G-, and 1C-sequences relative to the mean abundance of all sequences from the same cluster (relative sequence abundance) is shown (pachytene piRNA precursors are ranked as in A and B).

