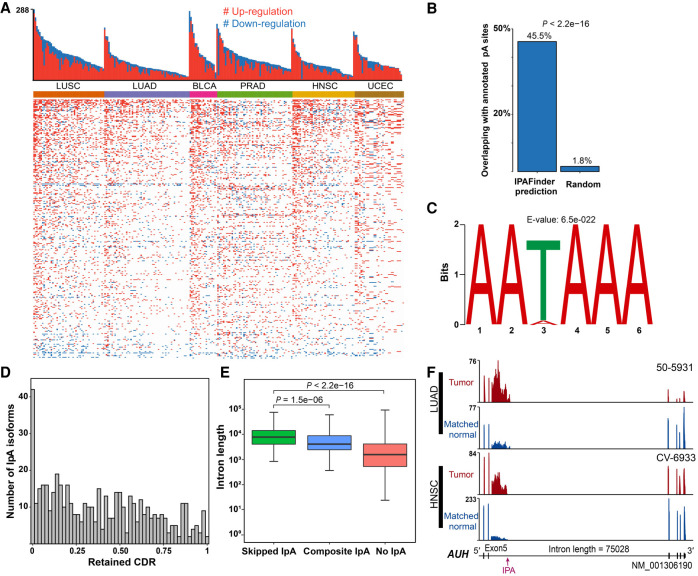
Figure 2.
IPAFinder reveals the global landscape of IpA events across six TCGA tumor types. (A) IPAFinder discovers prevalent up-regulation of IpA events across six tumor types. The upper histogram shows the number of dynamically changed IpA events per tumor. The lower heatmap shows IpA events (rows) undergoing up-regulation (red) or down-regulation (blue) in each of the 256 tumors (columns) compared with the levels in matched normal tissues across six tumor types. (B) Bar plots showing the percentages of IPAFinder-predicted breakpoints (left) and the randomly selected positions (right) that overlap with annotated intronic pA sites (RefSeq, UCSC, Ensembl, PolyASite 2.0). The P-value was calculated by t-test using 100× bootstrapping of data. (C) MEME identifies the enrichment of the canonical poly(A) signal AATAAA in the ±50 bp region around IPAFinder-inferred IPA sites. The corresponding genomic sequences (from human reference sequence hg38) serve as input. (D) The distribution of the retained coding region fraction (resulting from IpA usage) of the annotated longest coding region (CDR). (E) Box plot for lengths of introns with skipped IpA, composite IpA, and introns without IpA. The P-value was calculated based on a two-sided Wilcoxon rank-sum test. (F) AUH as an example to display skipped IPA sites with increased usage in two types of cancer (LUAD and HNSC) located in an extremely long intron. Sample IDs are shown at the top right corner of the corresponding RNA-seq density plot.

