Figure 3.
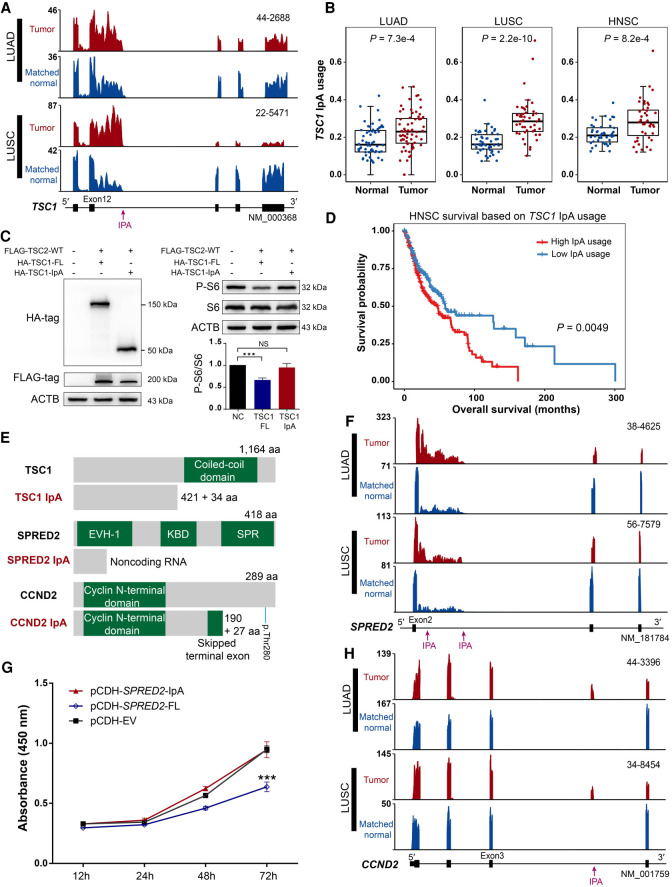
IpA generates truncated proteins with important functional impacts. (A) RNA-seq density plots showing that TSC1 has increased IpA usage in lung cancers. Numbers on the y-axis indicate RNA-seq read coverage. Sample IDs are shown at the top right corner of the corresponding RNA-seq density plot. (B) Box plots showing that TSC1 has significantly higher IpA usage in LUAD, LUSC, and HNSC tumors. The P-value was calculated based on a two-sided Wilcoxon rank-sum test. (C) Immunoblot analysis of S6 phosphorylation in HEK293T cells with overexpression of the IpA and full-length (FL) isoform of TSC1. Successful expression of HA-tagged IpA and full-length isoforms of TSC1 was confirmed by western blot using anti-HA and anti-FLAG antibodies (left). Both total S6 protein and its phosphorylated form (P-S6) were also quantified by western blot (right). ACTB was used as an internal control. Negative control (NC) means a sample without FLAG-TSC2-WT, HA-TSC1-FL, and HA-TSC1-IpA. (***) P-value < 0.001, t-test. (D) Kaplan–Meier curves of overall survival for two HNSC tumor groups stratified by the IpA usage of TSC1. The P-value was calculated using the log-rank test. (E) Diagrams showing the domain information of full-length and IpA-generated truncated proteins, with known domains shown in green. The numbers of retained and novel amino acids (aa) and amino acids of full-length proteins are given. The position of the important residue Thr280 of CCND2 is denoted by a short blue line (p.Thr280). (F) RNA-seq density plots showing that SPRED2 has increased IpA usage in lung cancers. (G) CCK-8 assay showing that IpA-truncated SPRED2 fails to inhibit cell proliferation in NCI-H520 cells. (***) P-value < 0.001, t-test. (H) RNA-seq density plots showing that CCND2 has increased IpA usage in lung cancers.

