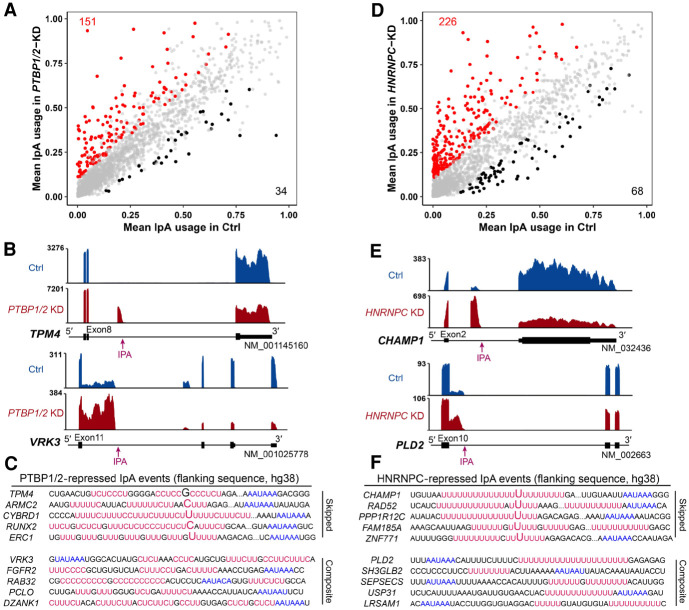
Figure 4.
PTBP1/2 and HNRNPC inhibit the usage of IPA sites. (A) Scatterplot of IPUI value reflecting the relative IpA usage before and after concurrent knockdown of PTBP1 and PTBP2 (PTBP1/2-KD) in HEK293 cells. Red and blue dots represent genes with increased and decreased IpA usage upon knockdown of PTBP1/2, respectively. (B) Representative examples of IpA events repressed by PTBP1/2. Both the skipped IpA event (top) and the composite IpA event (bottom) are shown. (C) Sequences flanking example IPA sites repressed by PTBP1/2 have CU repeats (red) and poly(A) signals (blue). Five genes with a skipped terminal exon (top) and five genes with a composite terminal exon (bottom) are shown. The first bases of skipped terminal exons are denoted by enlarged characters. (D) Scatterplot of IPUI value reflecting the relative IpA usage before and after knockdown of HNRNPC (HNRNPC-KD) in HEK293T cells. Red and blue dots represent genes with increased and decreased IpA usage in HNRNPC-KD cells, respectively. (E) Representative examples of HNRNPC-repressed IpA events. (F) Sequences flanking example IPA sites repressed by HNRNPC have (U)5 tracts (red) and poly(A) signals (blue).

