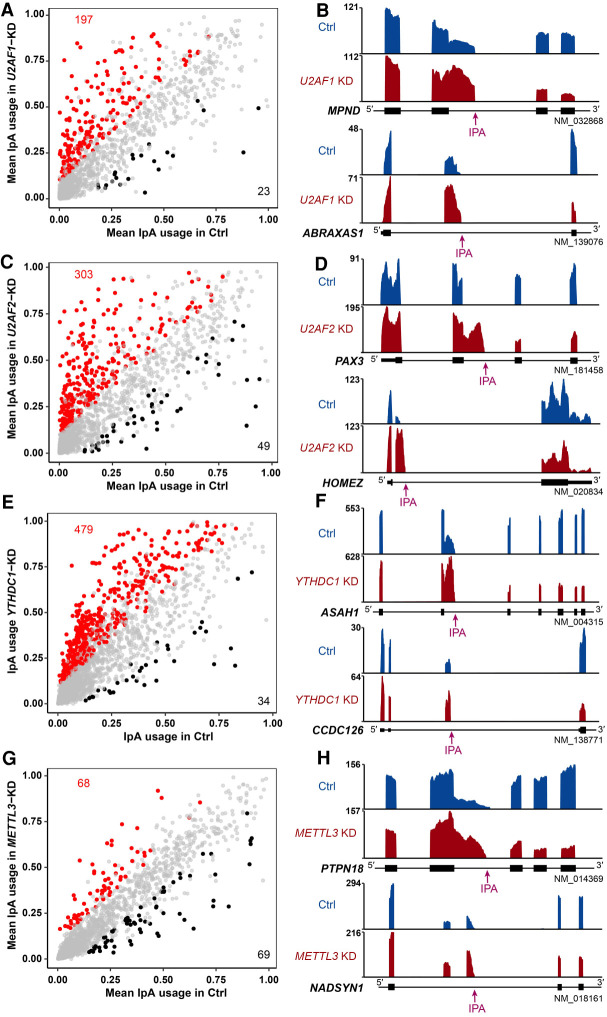
Figure 5.
IPAFinder reveals that intronic polyadenylation can be influenced by factors related to splicing and m6A modification. (A,C,E,G) Scatterplot of IPUI values reflecting the relative IpA usage in cells with knockdown (KD) of U2AF1 (A, in HFF cell), U2AF2 (C, in HFF cell), YTHDC1 (E, in HeLa cell), or METTL3 (G, in HEK293T cell). Red and blue dots represent genes with increased and decreased IpA usage upon knockdown of corresponding genes. (B,D,F,H) Representative RNA-seq density plots for genes with significantly increased IpA usage upon knockdown of U2AF1 (B), U2AF2 (D), YTHDC1 (F), or METTL3 (H). Each knockdown condition has two IpA examples: the composite terminal exon IpA (top) and the skipped terminal exon IpA (bottom).

