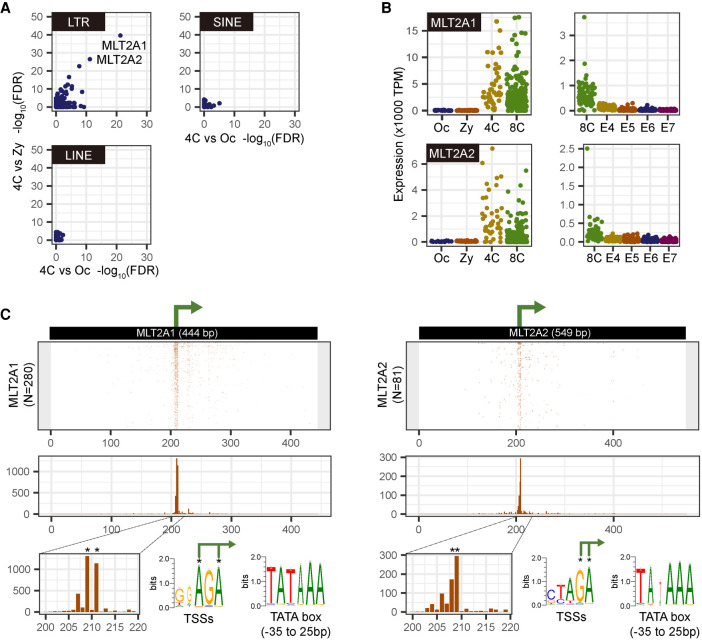
Figure 1.
Activation of MLT2A1 and MLT2A2 copies in four-cell stage human embryos. (A) Scatter plots of −log10(FDR) values for differential expression between four-cell embryo and oocyte (x-axis) and between four-cell embryo and zygote (y-axis) by using single-map reads; the plots, including multimap reads, are shown in Supplemental Figure S1B. Each dot represents a family of LTR, LINE, or SINE. (B) Normalized expression values (tags per million mapped tags [TPM]) of MLT2A1 and MLT2A2 in each single-cell: (Oc) oocyte; (Zy) zygote; (4C) four-cell embryo; (8C) eight-cell embryo; (E4 to E7) embryo on day 4 to day 7. STRT data from oocyte to eight-cell embryos are shown in the left panels, and RNA-seq data from eight-cell embryo to embryo on day 7 are shown in the right panels. (C) Location of transcription start sites (TSSs) on the active MLT2A1 and MLT2A2 elements. The middle panel shows the frequency of TSSs at each position. Asterisks indicate two most frequent positions.

