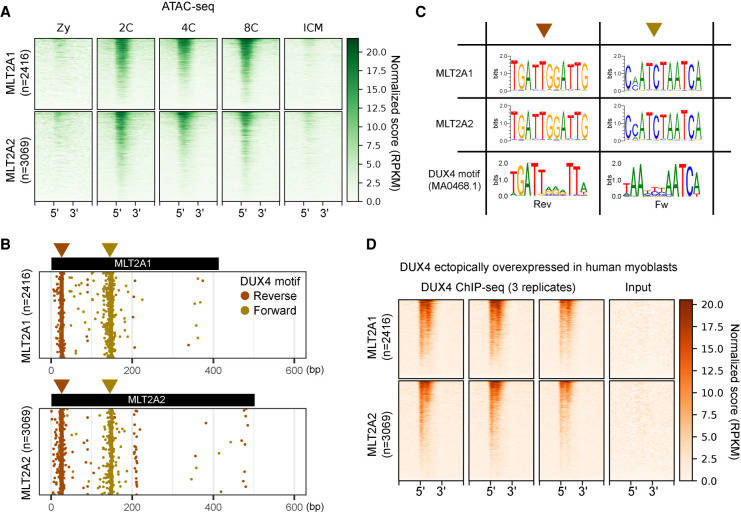
Figure 2.
Chromatin states of MLT2A1 and MLT2A2 elements. (A) Chromatin states of all MLT2A elements and flanking regions (±1 kb) in five stages: (Zy) zygote; (2C) two-cell embryo; (4C) four-cell embryo; (8C) eight-cell embryo; (ICM) inner cell mass. All elements are scaled to the same size, with 5′ and 3′ denoting their ends. The elements are sorted from the top to the bottom according to ATAC-seq signal intensity. (B) Distribution of DUX4 binding motifs (MA0468.1) in all MLT2A elements; the motifs were identified by using MAST software. Motifs in the reverse and forward orientations are denoted as brown and gold circles, respectively. (C) Sequence logos of DUX4 motif-enriched regions in MLT2A1 and MLT2A2 and logos of the original DUX4 motif in the reverse (Rev) and forward (Fw) orientations. (D) DUX4 binding states in all MLT2A elements and flanking regions (±1 kb) for three replicates of ChIP-seq samples and one input sample.

