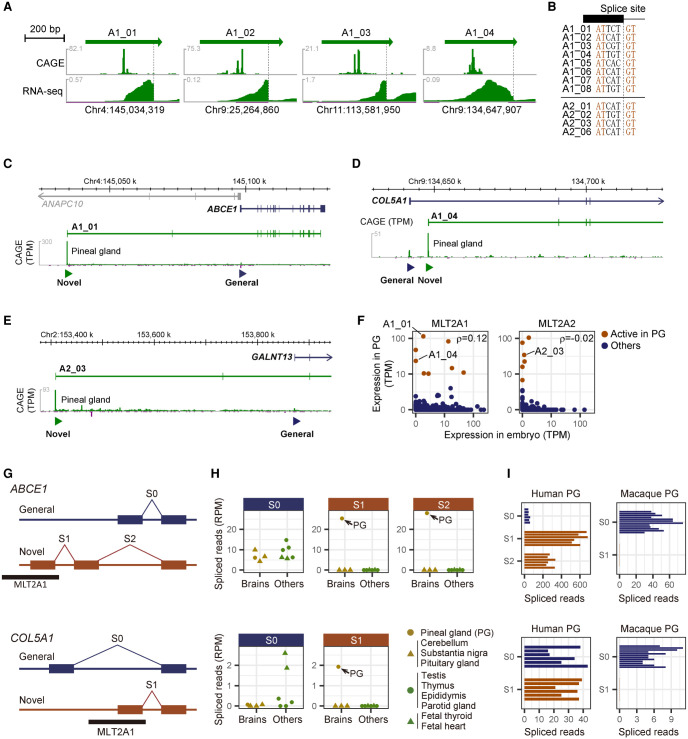
Figure 5.
Pineal gland–specific novel promoters and splice junctions derived from MLT2A elements. (A) Expression patterns of individual MLT2A1 elements actively transcribed in pineal gland. CAGE captures the 5′ ends of the transcripts, whereas RNA-seq captures entire exons. Spliced sites are denoted by dashed lines. (B) DNA sequences of splice sites in the MLT2A1 and MLT2A2 elements. (C–E). Novel promoters used in pineal glands for ABCE1 (C), COL5A1 (D), and GALNT13 (E) genes. The novel promoters overlapped with MLT2A elements are denoted by green triangles. The transcript models (ENST00000296577.8 for ABCE1, ENST00000371817.7 for COL5A1, and ENST00000392825.7 for GALNT13) are from GENCODE. Expression signals of CAGE (tags per million mapped tags [TPM]) are shown in green peaks. (F) Normalized mean expression values (TPM) of individual MLT2A1 and MLT2A2 elements in early embryo (N = 225, all at four-cell or eight-cell stage) and pineal gland (PG, N = 3). The 14 elements actively transcribed in pineal gland are shown in brown. (G) Schematic representation of splice sites of ABCE1 and COL5A1. Novel splice junctions derived from MLT2A1 elements are denoted as S1 and S2, whereas common splice junctions are denoted as S0. (H) Normalized splice counts (spliced reads per million mapped reads [RPM]) in four human brain (gold) and six non-brain (green) tissues for ABCE1 (upper) and COL5A1 (lower). Pineal glands (PG) are denoted by gold circles. (I) Normalized splice counts in human and macaque pineal gland for ABCE1 (upper) and COL5A1 (lower). The human samples are from six different donors (GSE100472), and the macaque samples are from 12 different individuals (GSE78165).

