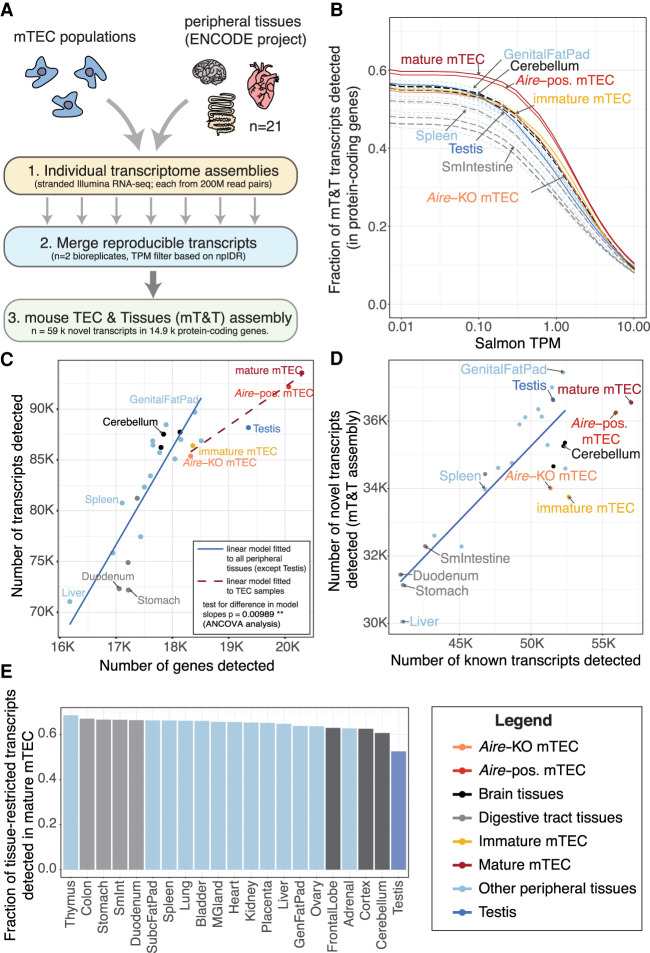
Figure 1.
Comparative analysis of transcript expression in mTEC and peripheral tissues. (A) Generation of a common mouse mTEC and peripheral Tissues (mT&T) transcriptome assembly. (B) Fractions of transcripts from protein-coding genes detected in peripheral tissues and mTEC populations across a range of TPM thresholds. The scatter plots (C,D) show the relationships between the number of genes and transcripts (C) and the number of known versus novel transcripts (D) detected in peripheral tissues and mTEC populations. The linear models shown in C and D were fitted to all samples except TEC and testis (solid trend lines) or to the TEC samples (C, dashed trend line). There was a significant difference in the trend line slopes in C (P = 0.00989, ANCOVA analysis). (E) Fractions of sets of tissue-restricted transcripts (tau ≥ 0.9) from peripheral tissues detected in mature mTEC (see also Supplemental Fig. 2I). Analyses shown were restricted to protein-coding genes and performed using a single high-depth sample per tissue. Similar results were obtained using lower-depth biologically replicate sample pools (n = 2) (Supplemental Fig. 2C–E,H).

