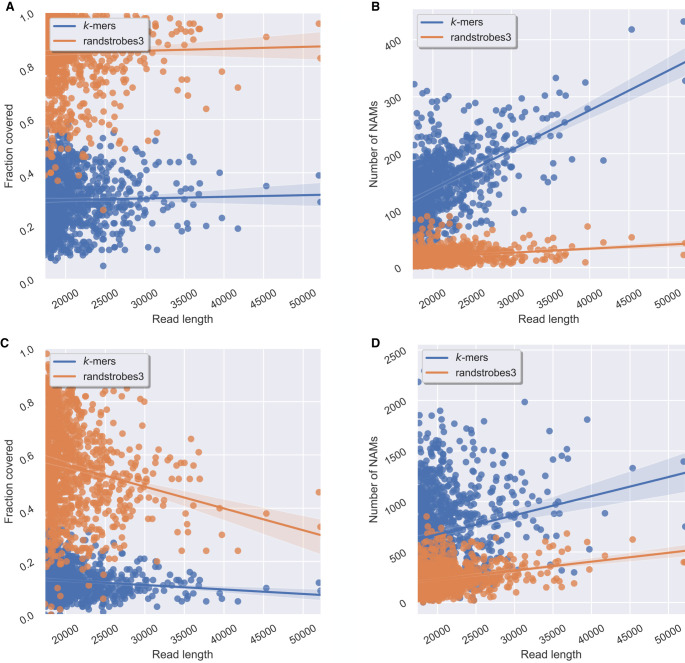
Figure 4.
Comparison between randstrobes and k-mers when mapping genomic ONT reads for reads of different lengths (x-axis). Panels A and B show read mapping results when mapping reads to the genome, and C and D when mapping reads to themselves. (A) Total fraction of the read covered by NAMs in the optimal collinear chaining solution to the genome (y-axis). (B) The total number of NAMs (y-axis) between a read and the genome. (C) Total fraction of the read covered by NAMs to the longest overlapping read, inferred from the optimal solution of a collinear chaining (y-axis). (D) The total number of NAMs (y-axis) generated for the read. The line shows the mean, and the shaded area displays a 95% confidence interval of the mean estimate. High NAM coverage and low number of NAMs mean long contiguous matches and facilitate accurate and efficient sequence comparison.

