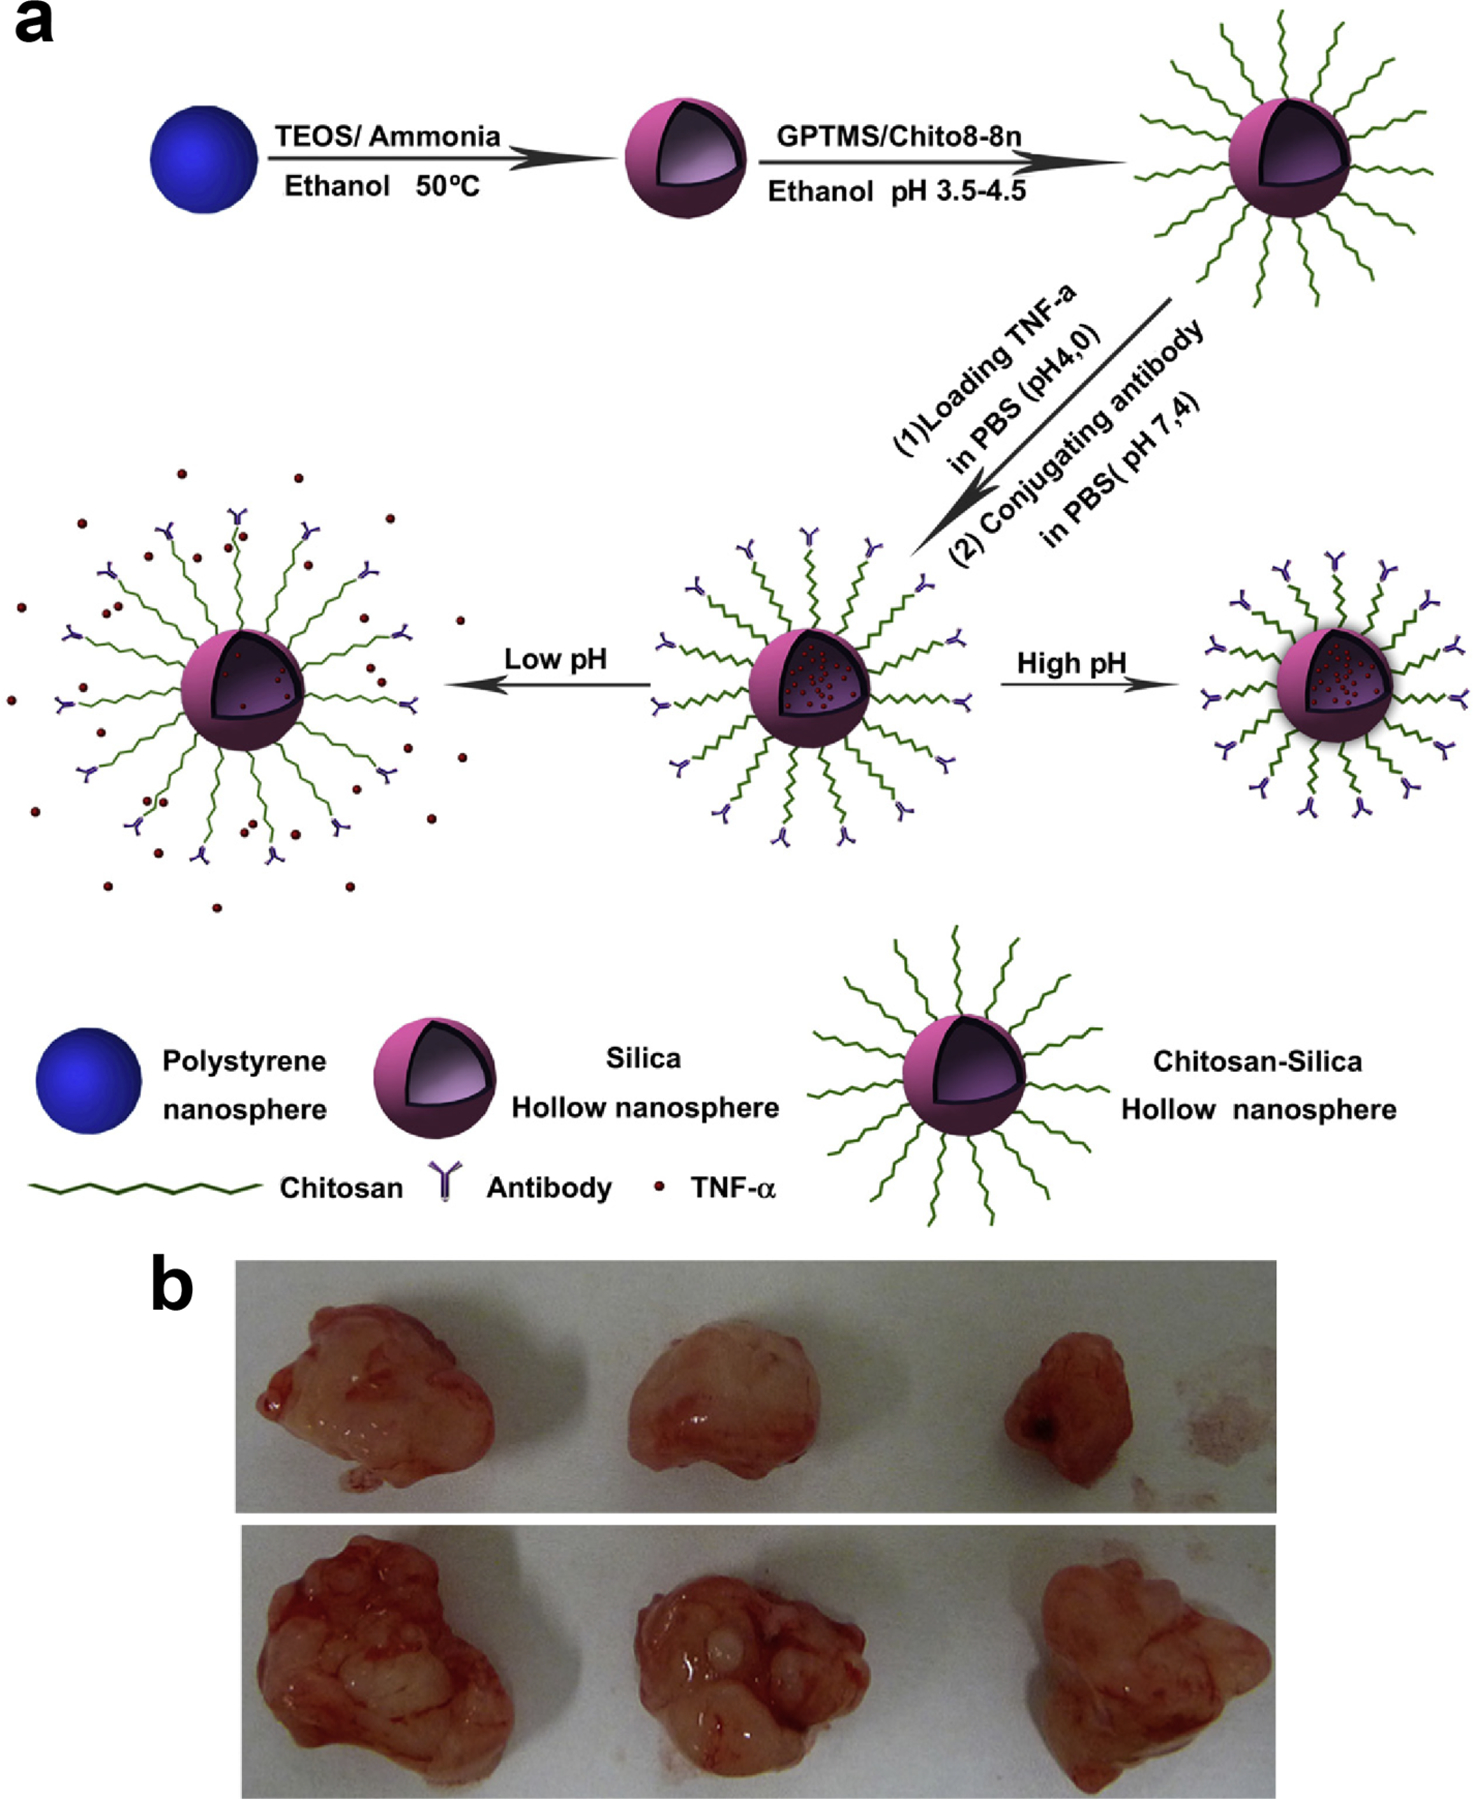
Fig. 11.

(a) Schematic diagram illustrating the formation of nanocarriers (MSNP-chitosan-TNF-a conjugated with antibody) and the drug release behavior at different pH values. This structure blocks and restricts drugs release from the hollow interior. (b) Photos of tumors collected from mice in Nano group; nanocarriers composed of CS-SiO2,HNPs, TNF-a and antibody were injected into the mice (top); PBS (pH 7.4) only was injected into the mice (bottom). (Adapted from ref.241).
