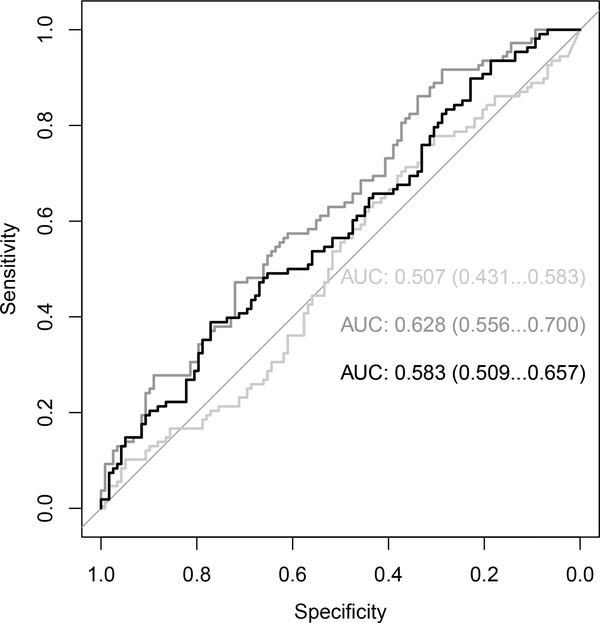
Figure 4:
Unweighted AUROC for best results for literature-derived confounders (querying method = PSI, # of confounders = 10) vs. (baseline = χ2). Light gray = χ2. Medium gray = [logistic regression coefficient]. Black = [average treatment effect/Δ]. The numbers to the right of the ROCs represent the 95% confidence intervals.

