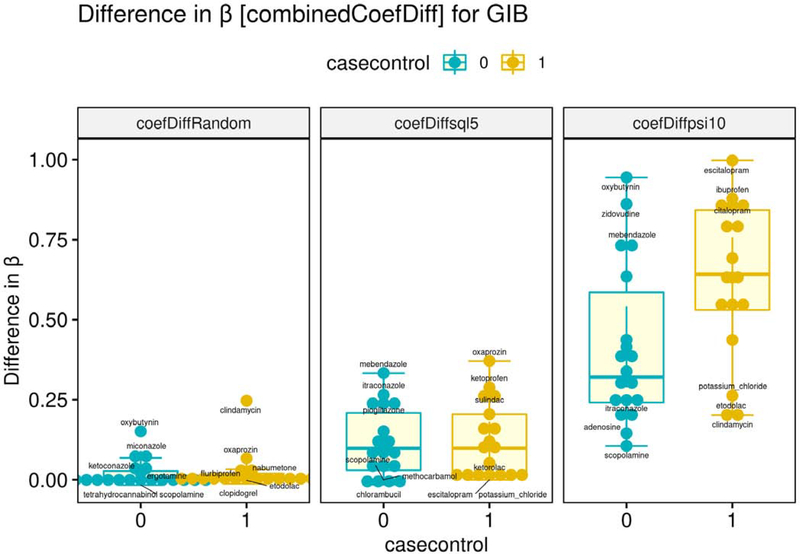
Figure 6:
These boxplots represent the differences in unadjusted vs. adjusted regression coefficients (β) for gastrointestinal hemorrhage. The leftmost boxplot shows these differences in β using randomly selected (irrelevant) covariates whereas the next two boxplots show the differences from using sql5 and psi10 confounder search. Controlling for literature-derived methods resulted in more considerable reductions in the negative controls’ estimates than randomly selected covariates. The boxplots generated for from the β difference for a drug/adverse event pair sample size of n = [17+, 18−]pairs. The highest and lowest scoring quartiles were excluded from the counts and statistics reported below.

