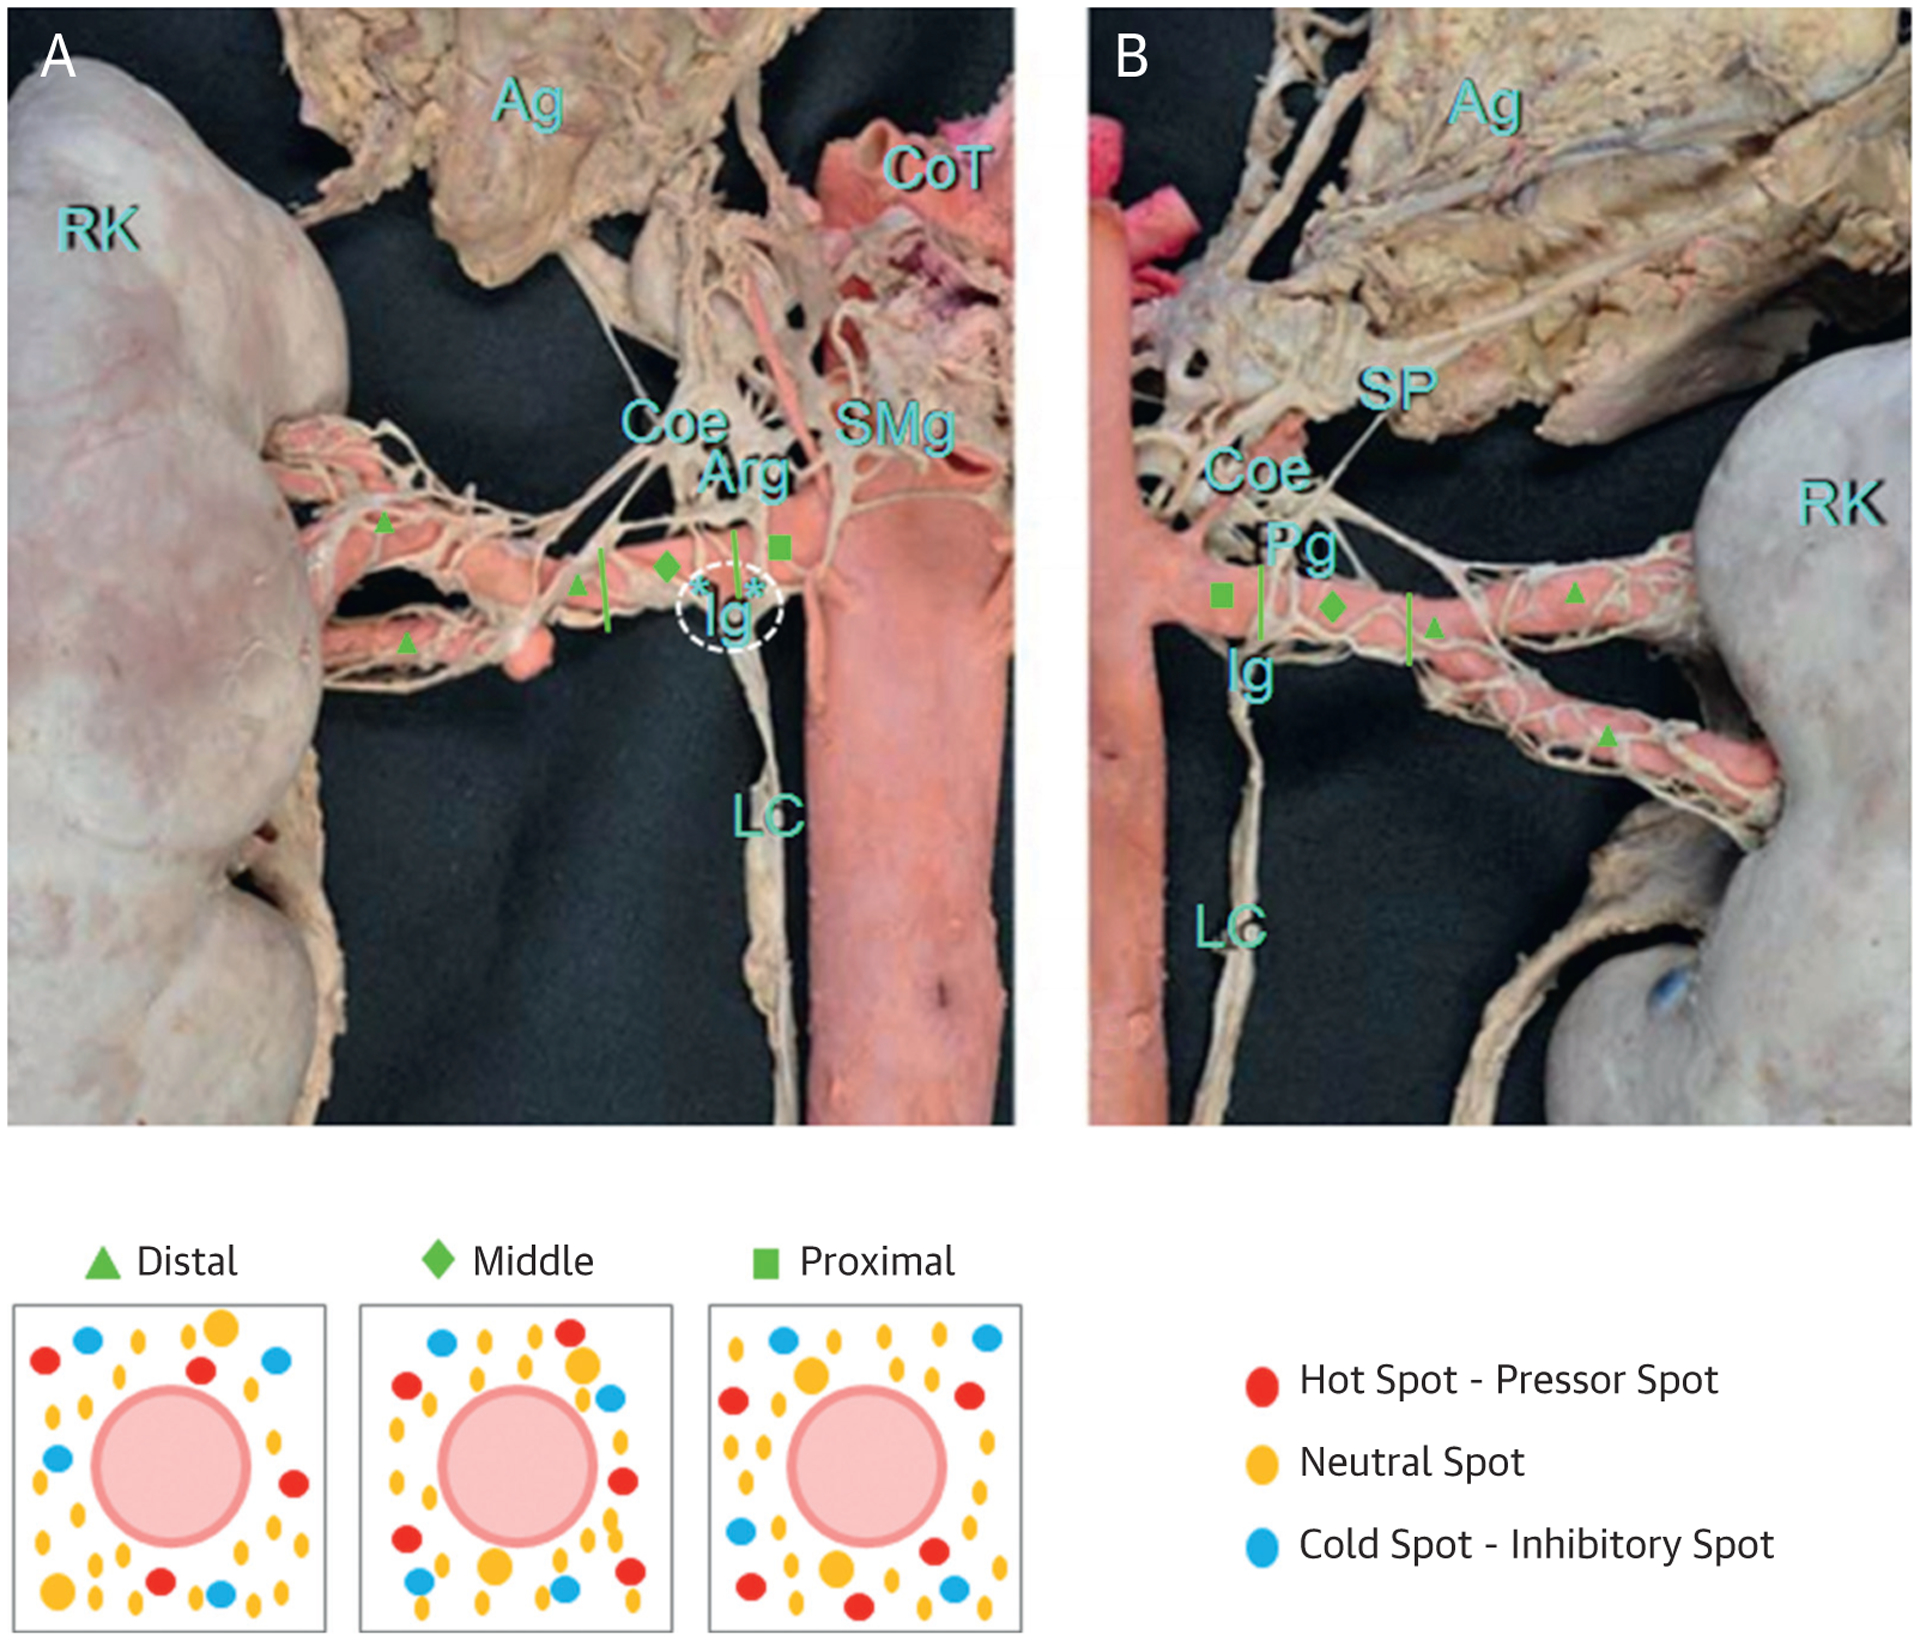
FIGURE 4. Theoretical Framework for Selective Versus Nonselective Renal Denervation.

(Top) The right renal artery sympathetic innervation in (A) anterior and (B) posterior views divided in 3 segments: proximal (green squares), middle (green diamonds), and distal (green triangles). (Bottom) A schematic concept for selective versus global renal denervation: red dots represent “hot spots”—pressor spots. These are nerves that when stimulated increase BP. They are the ideal target for renal denervation. Blue dots represent “cold spots”—inhibitory spots, which lower BP when stimulated. The yellow dots represent the majority of nerve fibers, which are neutral in their contribution to BP control and do not show hemodynamic effects when stimulated. *Connection between ganglia. Adapted with permission from Fudim et al. (39) Mompeo et al. (68). Ag = adrenal gland; Arg = aorticorenal ganglion; Coe = coeliac ganglion; CoT = coeliac trunk; Ig = renal inferior ganglion; LC = contribution of the lumbar chain to the renal plexus; Pg = renal posterior ganglion; RK = right kidney; SMg = superior mesenteric ganglion; SP = thoracic splanchnic nerves.
