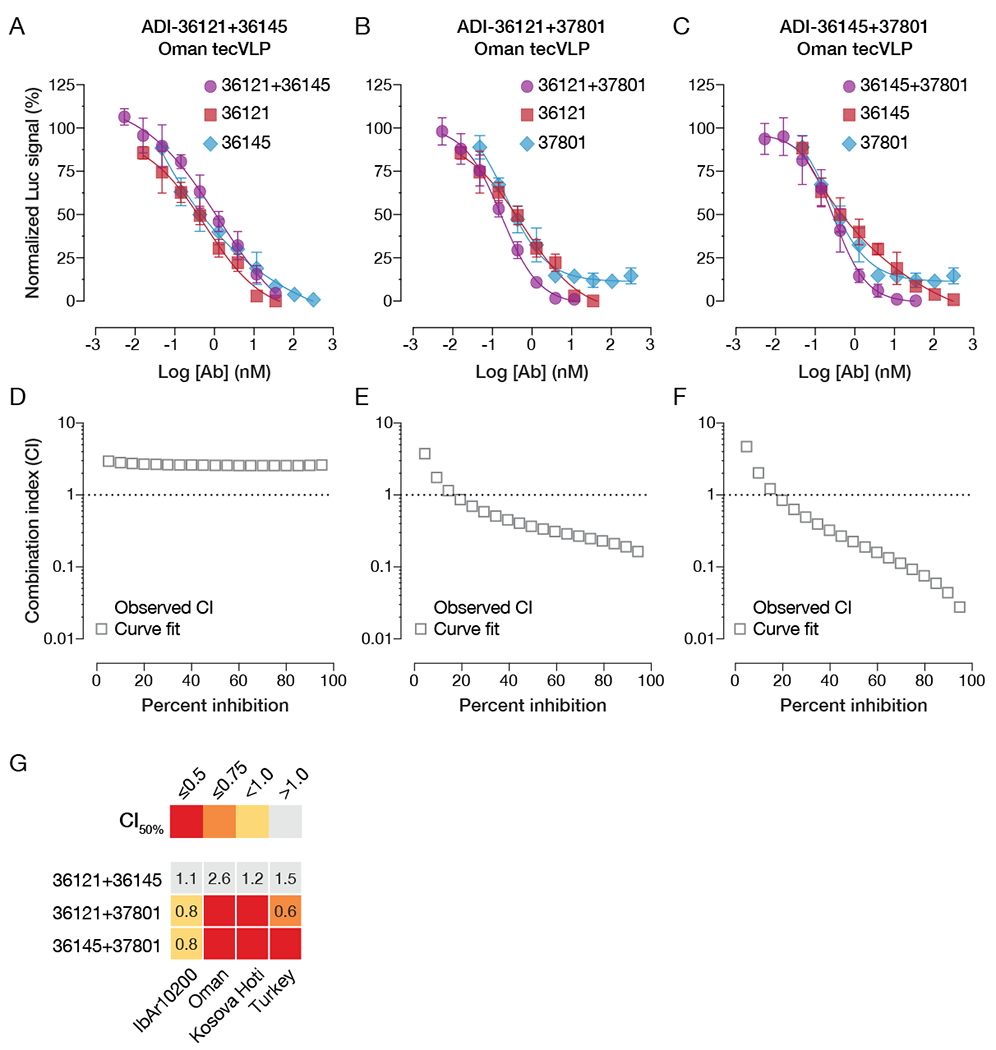
Figure 5. Synergistic neutralization potential of lead nAb candidates.

(A-C) Neutralization curves of individual nAbs and their 1:1 combinations. (A) ADI-36121 and ADI-36145, (B) ADI-36121 and ADI-37801, (C) ADI-36145 and ADI-37801. (D-F) Combination-index (CI) analyses of neutralization curves in panels A–C to determine additive (CI ~ 1) or synergistic effects (positive, CI < 1; negative, CI >> 1). (G) Summary of CI values at 50% neutralization for nAb combinations against tecVLPs carrying divergent Gn/Gc proteins. Synergistic neutralization was assayed in Vero target cells. n = 6, from two independent experiments for all neutralization curves. See also Figure S6.
