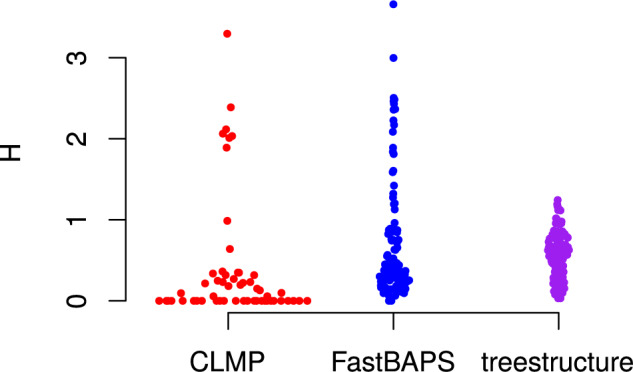
Figure 4.

Entropy ( ) of classification from several
tree partitioning algorithms applied to the structured coalescent simulations but only
counting lineages sampled from the exponentially growing outbreak.

Entropy ( ) of classification from several
tree partitioning algorithms applied to the structured coalescent simulations but only
counting lineages sampled from the exponentially growing outbreak.