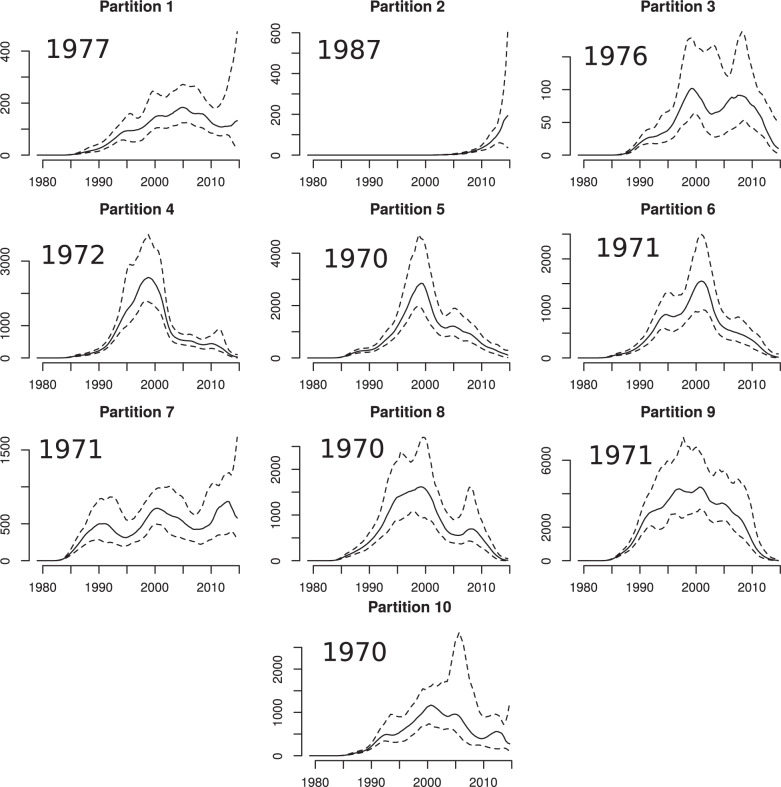
Figure 8.
Estimated effective population size through time for each partition in the Tennessee
HIV-1 phylogeny. Each panel is annotated with the median year of birth among HIV
patients in each partition.  was estimated using the
skygrowth method (Volz and Didelot
2018) with precision parameter
  .
.

