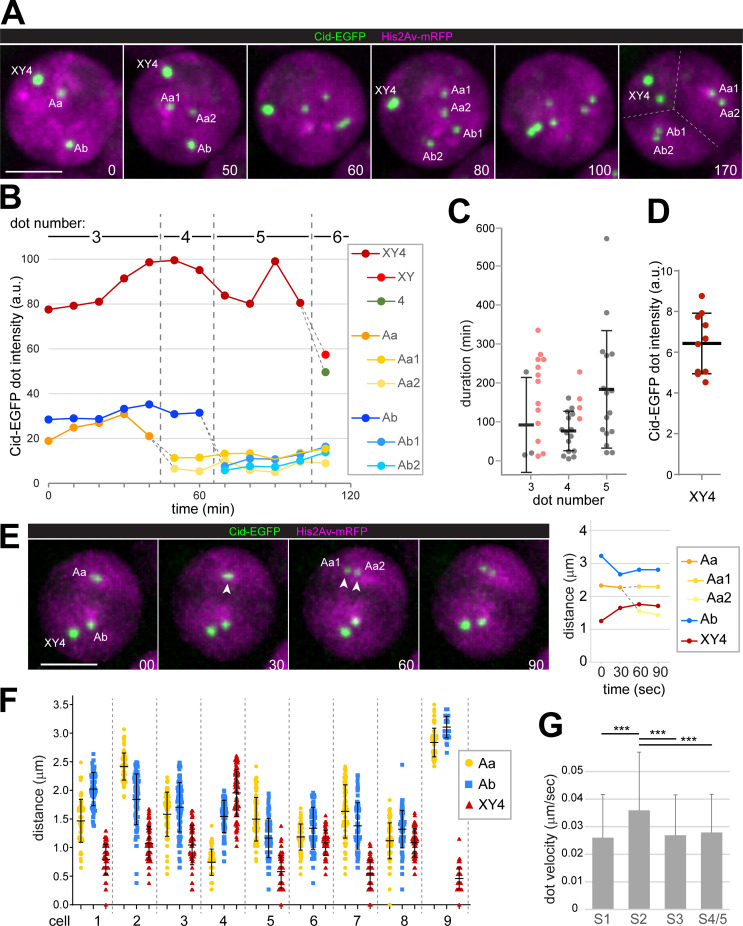
Fig 1. Disruption of centromere clusters during chromosome territory formation.
Spermatocytes expressing His2Av-mRFP and Cenp-A/Cid-EGFP were analyzed by time-lapse imaging. (A) Labeling of Cid-EGFP dots indicates their association with distinct chromosomes. “Aa” and “Ab” designate centromere clusters associated with the large autosomes (chr2 and chr3) with “1” and “2” denoting the two homologs. “X”, “Y” and “4” designate the clustered centromeres of the additional chromosomes (chrX, chrY and chr4). Complete separation of chromosome territories (dashed lines) is evident at the last time point. Scale bar = 5 μm. (B) Signal intensity of the Cid-EGFP dots displayed by the spermatocyte shown in (A). Dashed grey lines indicate dot-splitting events. (C) Duration of the stages with three, four and five Cid-EGFP dots per nucleus, respectively. Grey values represent actual stage durations determined for spermatocytes that progressed through both dot-splitting events delimiting a particular stage. Mean ± s.d. of these values is displayed as well. Values plotted in color are from cells, in which only one of the two delimiting dot-splitting events was observed during the imaging period, thus indicating minimal durations. (D) Relative Cid-EGFP signal intensity of the XY4 dot at the four-dot stage compared to the Aa1 dot (formed by the two tightly associated, unresolved sister centromeres of a large autosome). Mean ± s.d. is displayed as well (n = 10). (E) Cid-EGFP dots are far from the nuclear periphery during dot-splitting events. A representative event (Aa into Aa1 and Aa2) with a graph indicating the shortest distances between dots and nuclear periphery is shown. t = 0: start of stretching of the separating Cid-EGFP dot. (F) Position of Cid-EGFP dots relative to the nuclear periphery were tracked (after time-lapse imaging at five-second intervals over 7.5 min). Nine spermatocytes with three dots (Aa, Ab and XY4) were analyzed. Separation distance of a given Cid-EGFP dot at each time point (n = 89) is plotted, as well as mean ± s.d. (G) Cid-EGFP dots move faster during the S2 stage when chromosome territories form. Cid-EGFP dots were tracked (after time-lapse imaging at five-second intervals). Bars represent mean dot velocity (± s.d.) obtained by averaging over all dots present in a cell (i.e., 3–5 dots depending on stage) over all 99 time intervals and over all cells analyzed for a given stage (3–5 spermatocytes, see S3 Fig). *** indicates p < .001 (t test). Scale bars = 5 μm.

