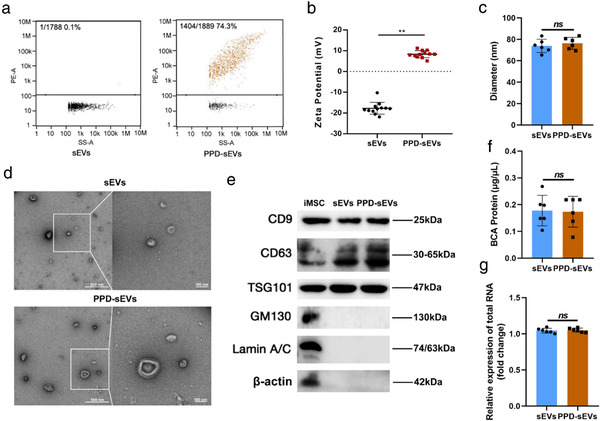
FIGURE 2.

Characterization of PPD‐sEVs. (A) The PPD modification rate of sEVs incubating with 100 μg/ml PPD suspension. RITC labeled PPD (100 μg/ml) was incubated with sEVs (1 × 10¹⁰ particle/ml), and PPD‐sEVs were isolated by ultracentrifugation before detected by a nano‐flow cytometry; (B) Zeta potential of sEVs and PPD‐sEVs (n = 12); (C) Average particle diameter of sEVs and PPD‐sEVs measured and analyzed by a nano‐flow cytometry; (D) Representative TEM image of PPD‐sEVs or sEVs, scale bar: 500 and 100 nm; (E) Western Blot analysis of CD9, CD63, TSG101, GM130, Lamin A/C, and β‐actin from iMSC, sEVs, and PPD‐sEVs. CD9, CD63, and TSG101: sEVs specific marker; GM130: The Golgi marker; Lamin A/C: Nuclear marker; β‐actin: Cytoskeletal marker; (F) The protein concentration of sEVs and PPD‐sEVs were detected by BCA assay (n = 6); (G) Total RNA amounts in sEVs and PPD‐sEVs group were analyzed by using the RNA dye SYTO to label sEVs RNA (n = 6) **P < 0.01
