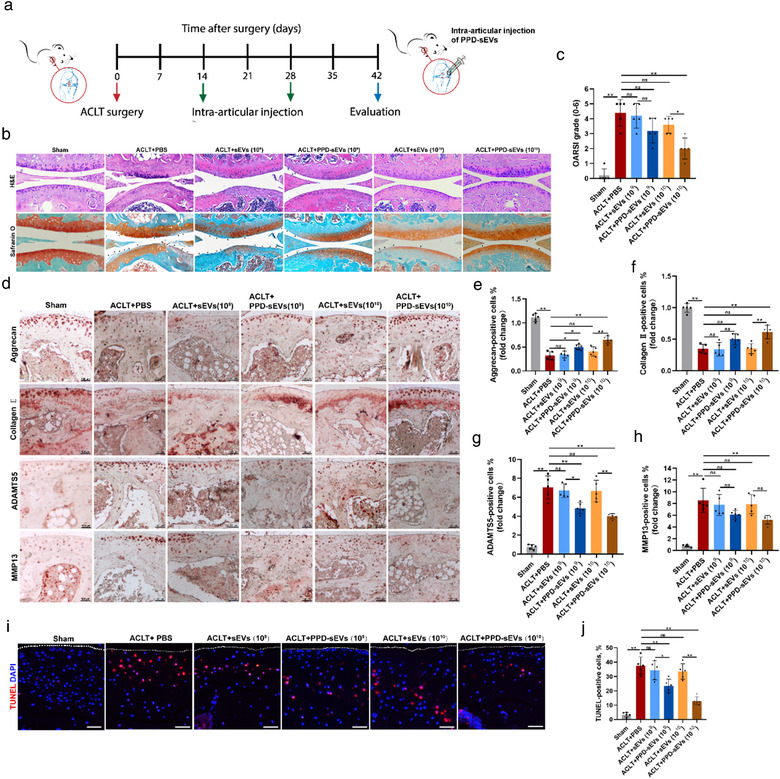
FIGURE 8.

Reduced injection frequency of PPD‐sEVs for OA improvement. (A) Schematic illustration of processing timeline and procedures; (B) Representative H&E and Safranin O‐Fast Green (Safranin O) staining images in each group. Black triangles indicate cartilage loss and destruction, scale bar: 200 μm; (C) Statistic data of OARSI scores in each group (n = 5); (D) Representative images of immunohistochemistry analysis for cartilage matrix anabolism biomarkers (Aggrecan, Collagen Ⅱ) and catabolism biomarkers (ADAMTS5, MMP13) in each group, scale bar: 100 μm; (E, F) Quantitative analysis of immunohistochemical staining of Aggrecan and Collagen II (n = 5); (G, H) Quantitative analysis of immunohistochemical staining of ADAMTS5 and MMP13 (n = 5), the fold change of each marker in each group was normalized against the Sham group (vs. Sham group); (I, J) Detection of TUNEL‐positive (Red) chondrocytes in articular cartilage by TUNEL staining and the statistical results (n = 5), scale bar, 100 μm. *P < 0.05, **P < 0.01
