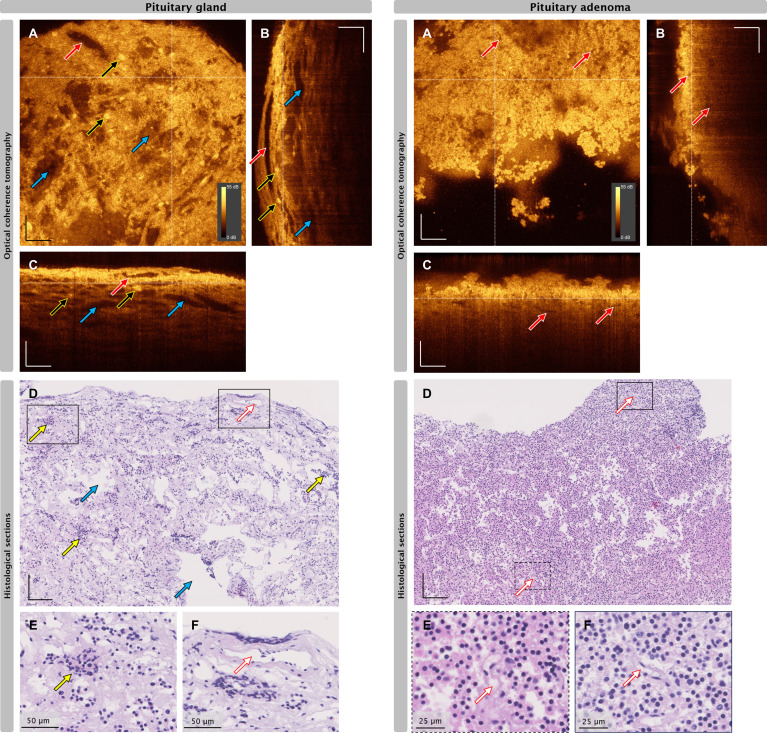
Figure 1.
Correlation of OCT and histopathological images of pituitary gland tissue (left) and pituitary adenoma (right). (A) Enface OCT projections, white dotted lines indicate positions of cross-sectional OCT (B-scan) positions. (B, C) B-scans at the indicated positions depicted in A. (D–F) H&E slices of the same biopsy. Red arrows: blood vessel, yellow arrows: representative nests, blue arrows: mechanical or freezing artifacts. Scale bars without label: 100 µm. Dynamic range 0-55 dB applicable for each OCT image.

