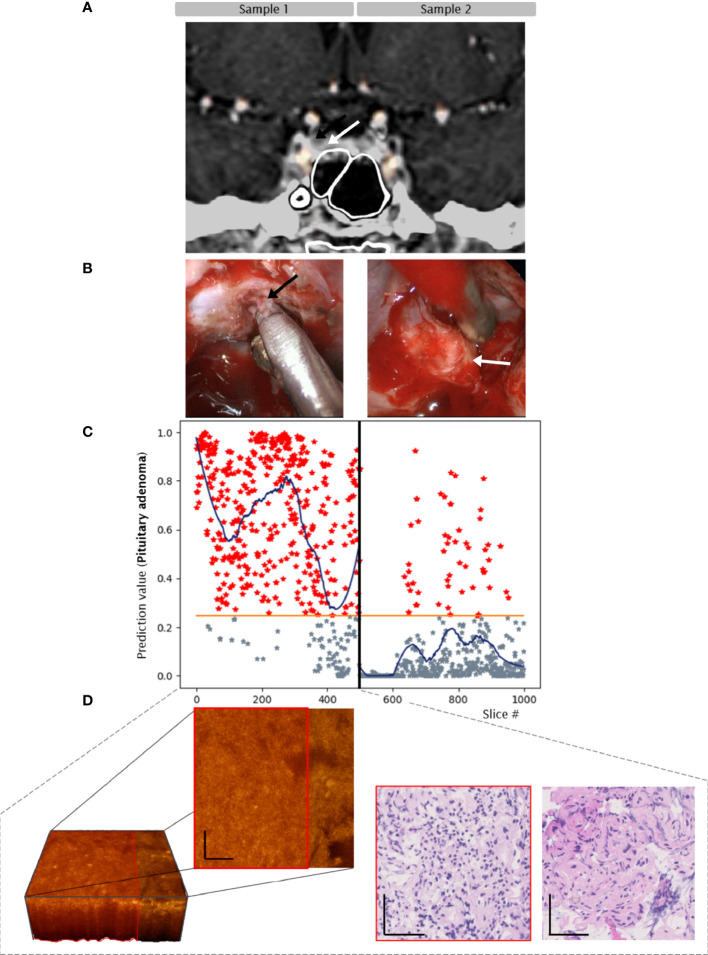
Figure 4.
Case 3. Convolutional neuronal network assessment of OCT images of samples of pituitary adenoma (black arrow) and adjacent gland (white arrow). (A) MRI, 8mm microadenoma. (B) intraoperative imaging. (C) Diagram of pituitary adenoma probability. X axis: number of each classified slice (500 per sample). The orange line indicates the classification threshold for pituitary adenoma/non-adenoma. The blue curve indicates an average of 150 slices to visualize the network prediction. (D) OCT 3-dimensional visualization of the sub-volume of sample 1 – pituitary adenoma (red box) with connective tissue, H/E slices of segements of pituitary adenoma and fibrous tissue. Scale bars: 50 µm.

