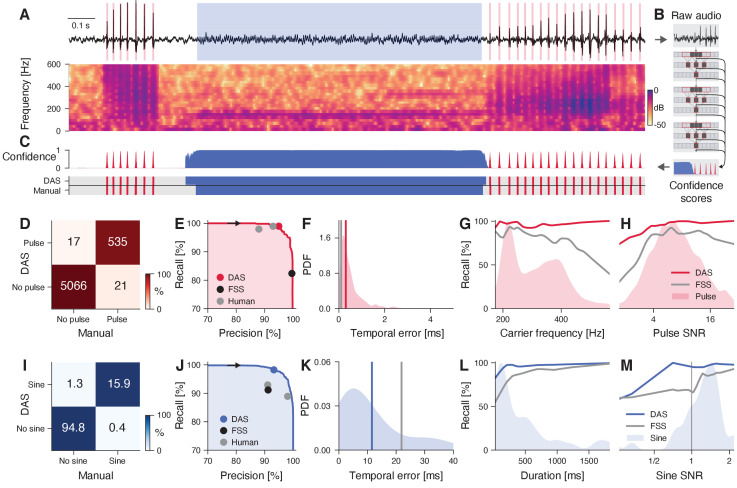
Figure 1. DAS performance for fly song.
(A) Fly song (black, top) with manual annotations of sine (blue) and pulse (red) song. The spectrogram (bottom) shows the signal’s frequency content over time (see color bar). (B) DAS builds a hierarchical presentation of song features relevant for annotation using a deep neural network. The network consists of three TCN blocks, which extract song features at multiple timescales. The output of the network is a confidence score for each sample and song type. (C) Confidence scores (top) for sine (blue) and pulse (red) for the signal in A. The confidence is transformed into annotation labels (bottom) based on a confidence threshold (0.5 for sine, 0.7 for pulse). Ground truth (bottom) from manual annotations shown for comparison. (D) Confusion matrix for pulse from the test data set. Color indicates the percentage (see color bar) and text labels indicate the number of pulses for each quadrant. All confusion matrices are normalized such that columns sum to 100%. The concentration of values along the diagonal indicates high annotation performance. (E) Precision-recall curve for pulse depicts the performance characteristics of DAS for different confidence thresholds (from 0 to 1, black arrow points in the direction of increasing threshold). Recall decreases and precision increases with the threshold. The closer the curve to the upper and right border, the better. The red circle corresponds to the performance of DAS for a threshold of 0.7. The black circle depicts the performance of FlySongSegmenter (FSS) and gray circles the performance of two human annotators. (F) Probability density function of temporal errors for all detected pulses (red shaded area), computed as the distance between each pulse annotated by DAS and the nearest manually annotated pulse. Lines depict the median temporal error for DAS (red line, 0.3 ms) and FSS (gray line, 0.1 ms). (G, H) Recall of DAS (red line) and FSS (gray line) as a function of the pulse carrier frequency (G) and signal-to-noise ratio (SNR) (H). Red shaded areas show the distributions of carrier frequencies (G) and SNRs (H) for all pulses. DAS outperforms FSS for all carrier frequencies and SNRs. (I) Same as in D but for sine. Color indicates the percentage (see color bar) and text labels indicate seconds of sine for each quadrant. (J) Same as in E but for sine. The blue circle depicts the performance for the confidence threshold of 0.5. (K) Distribution of temporal errors for all detected sine on- and offsets. Median temporal error is 12 ms for DAS (blue line) and 22 ms for FSS (gray line). (L, M) Recall for DAS (blue line) and FSS (gray line) as a function of sine duration (L) and SNR (M). Blue-shaded areas show the distributions of durations and SNRs for all sine songs. DAS outperforms FSS for all durations and SNRs.


