. 2021 Nov 1;10:e68837. doi: 10.7554/eLife.68837

Figure 3. DAS performance for the song of Bengalese finches.

(A) Waveform (top) and spectrogram (bottom) of the song of a male Bengalese finch. Shaded areas (top) show manual annotations colored by syllable type. (B) DAS and manual annotation labels for the different syllable types in the recording in A (see color bar). DAS accurately annotates the syllable boundaries and types. (C) Confusion matrix for the different syllables in the test set. Color was log-scaled to make the rare annotation errors more apparent (see color bar). Rows depict the probability with which DAS annotated each syllable as any of the 37 types in the test dataset. The type of 98.5% of the syllables were correctly annotated, resulting in the concentration of probability mass along the main diagonal. (D) Distribution of temporal errors for the on- and offsets of all detected syllables (green-shaded area). The median temporal error is 0.3 ms for DAS (green line) and 1.1 ms for TweetyNet Cohen et al., 2020, a method developed to annotate bird song (gray line).

Figure 3.

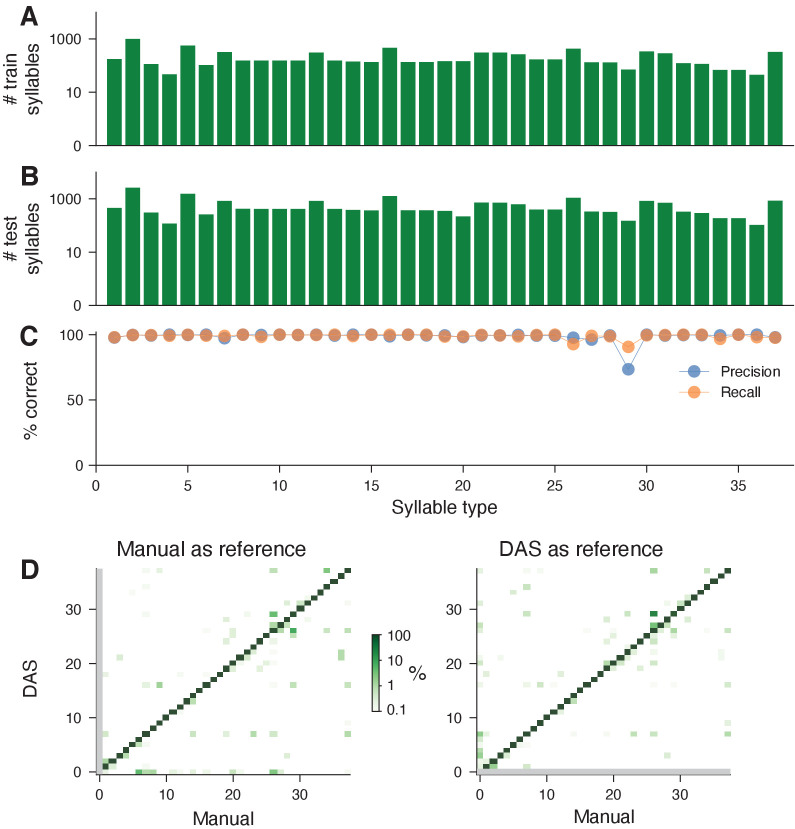
Figure 3—figure supplement 1. Performance for the song of Bengalese finches.

Figure 3—figure supplement 1.

(A, B) Number of syllables (log scaled) in the train (A) and the test (B) sets for each syllable type present in the test set. (C) Precision (blue) and recall (orange) for each syllable type, computed from the confusion matrix in Figure 3C. (D) Confusion matrices when using true (left, same as Figure 3C) and predicted (right) syllables as a reference. Colors were log-scaled to make the rare annotation errors more apparent (see color bar). The reference determines the syllable bounds and the syllable label is then given by the most frequent label found in the samples within the syllable bounds. When using the true syllables for reference, there are no false positives (left, y=0 (no song), gray line) since all detections are positives. By contrast, when using the predicted syllables as reference, there are no true negatives (right, x=0 (no song), gray line), since all reference syllables are (true or false) positives. The average false negative and positive rates are 0.3% and 0.2%, respectively.
Figure 3—figure supplement 2. Performance for the song of a Zebra finch.

Figure 3—figure supplement 2.

(A) Waveform (top) and spectrogram (bottom) of the song of a male Zebra finch. Shaded areas (top) show manual annotations of the six syllables of the male’s motif, colored by syllable type. (B) DAS and manual annotation labels for the six syllable types in the recording in A (see color bar). DAS accurately annotates the syllable boundaries and types. (C) Confusion matrix for the six syllables in the test set (see color bar). Rows depict the probability with which DAS annotated each syllable as any of the six types in the test dataset. The type of 100% (54/54) of the syllables were correctly annotated, resulting in the concentration of probability mass along the main diagonal. (D) Distribution of temporal errors for the on- and offsets of all detected syllables in the test set (blue-shaded area). The median temporal error is 1.3 ms for DAS (blue line) and 2 ms for TweetyNet (Cohen et al., 2020), a method developed to annotate bird song (gray line).