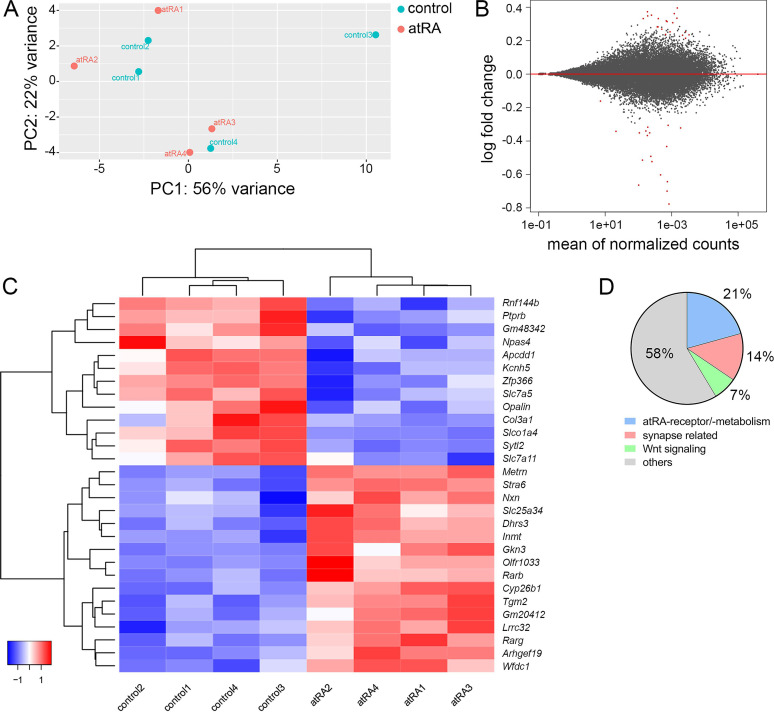
Figure 5. Hippocampal transcriptome analysis reveals no major differences in synapse-related genes following intraperitoneal injection of all-trans retinoic acid (atRA).
(A) Principal component analysis with ‘treatment’ as primary factor reveals no treatment-specific clustering of hippocampal mRNA samples (n=4 animals, one hippocampus each). (B) DESeq2-Analysis reveals differential expression of genes with a moderate │log2FC│<1 (visualization by MA plot). (C) Heatmap showing the z-scores of 29 differentially expressed genes. The differential expression of genes depends on the atRA treatment, as indicated by the z-score clustering. (D) Subsets of genes can be attributed to atRA-signaling or atRA-metabolism, synaptic transmission, and Wnt-signaling, respectively.

