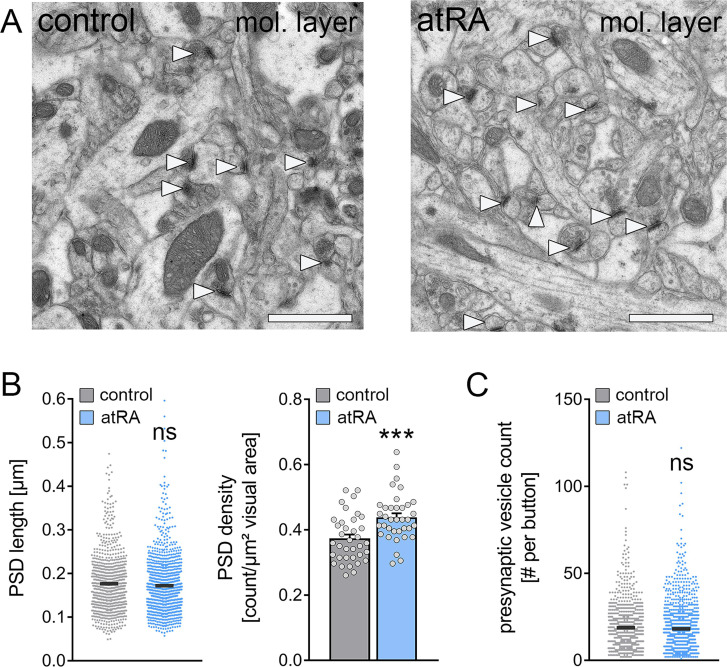
Figure 6. The numbers of cortico-hippocampal synapses in the dentate gyrus of the dorsal hippocampus are increased following intraperitoneal administration of all-trans retinoic acid (atRA).
(A) Representative electron microscopy images of asymmetric synapses (arrowheads) in the outer two-thirds of the molecular layer (mol. layer) of the dorsal hippocampus from atRA- or vehicle-only-injected mice. Scale bar=1 µm. (B) Group data of postsynaptic density (PSD) counts (ncontrol=36 individual images, natRA=36 individual images in three different animals with 12 images per sample; Mann-Whitney test, U=340) and analysis of PSD lengths of asymmetric synapses (ncontrol=908 PSDs, natRA=1189 PSDs in three different animals, one data point outside the axis limits in the control group; Mann-Whitney test). (C) Presynaptic vesicle counts are not significantly different between the groups (ncontrol=885 presynaptic buttons, natRA=1151 presynaptic buttons in three different animals, one data point outside the axis limits in the atRA group; Mann-Whitney test). Individual data points are indicated by gray dots. Values represent mean ± SEM. (***, p<0.001; ns, non-significant difference).

