. 2021 Oct 18;10:e73111. doi: 10.7554/eLife.73111

Figure 1. Different repertoire characteristics similarly separate between B cells subpopulations.

Principal component analysis (PCA) (left) and composition of the clusters formed using k-means clustering with k = 3 (right) applied on (A) all repertoire characteristics, (B) V family and J gene usage (see Figure 1—figure supplement 1), (C) physiochemical properties of CDR3 junction (see Figure 1—figure supplement 2) and (D) global repertoire metrics (see Figure 1—figure supplement 3). The percentage of all variation in the data that is explained by PC1 and PC2 is shown on the x and y axis, respectively, between brackets. In the PCA plots, areas are the convex hulls of the subsets, and the largest point of one colour represents the centre of that hull.

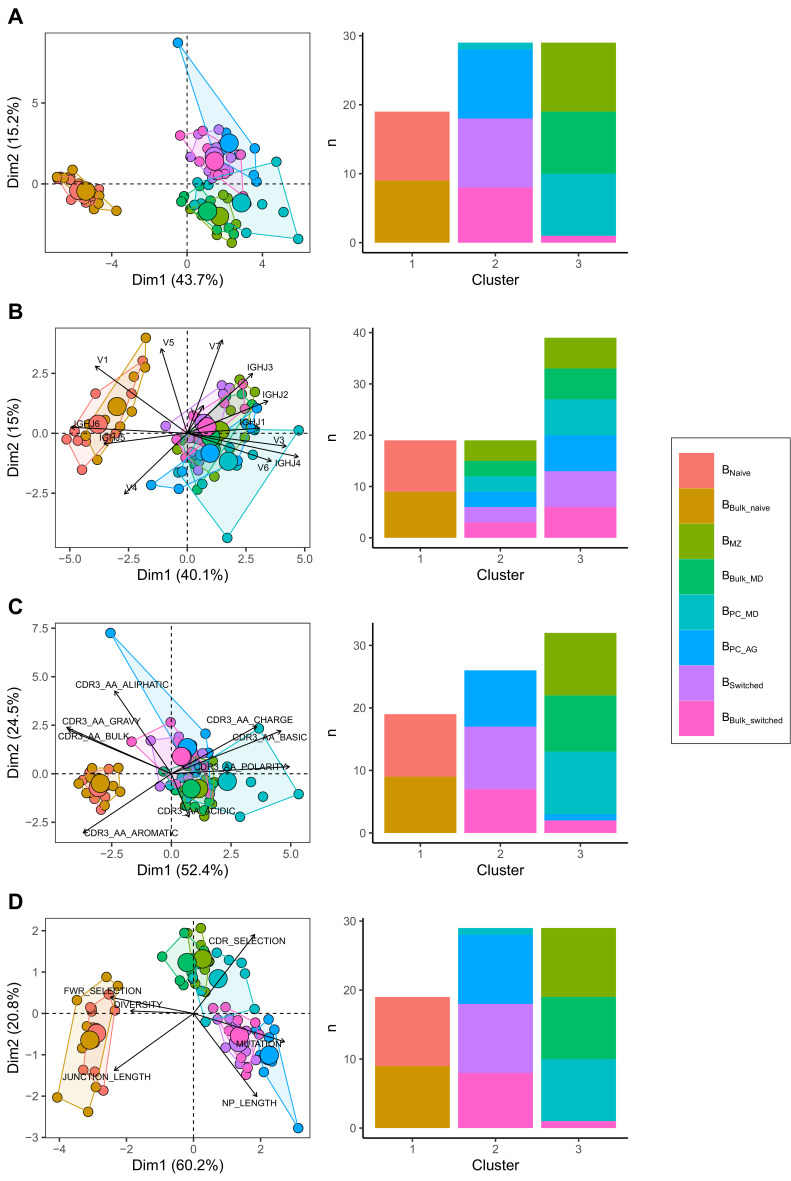
Figure 1—source data 1. Related to Figure 1A-D.

Figure 1.

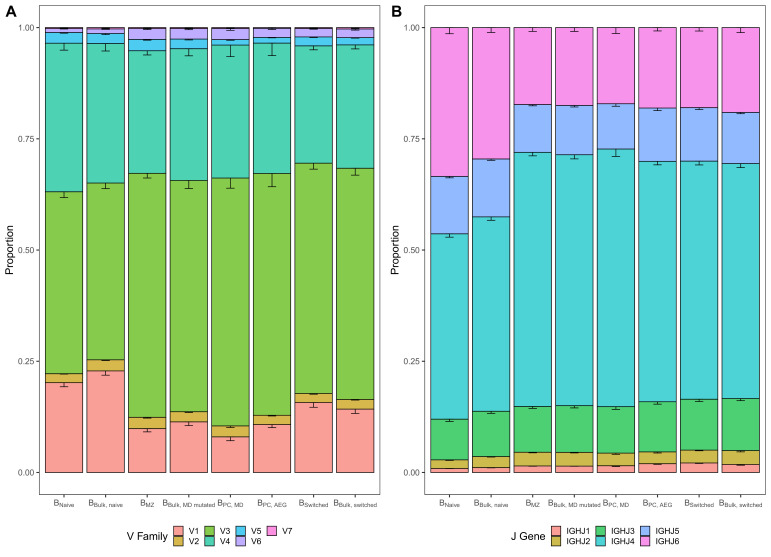
Figure 1—figure supplement 1. Differences in V and J gene usage across different B cell subpopulations.

Figure 1—figure supplement 1.

(A) V family and (B) J gene usage by B cell subpopulation representing data underlying PCA in Figure 1B. Bar plots indicate the proportion of sequences with a certain gene. Error bars represent the standard error of the mean. Underlying source data can be accessed under Figure 1—source data 1.
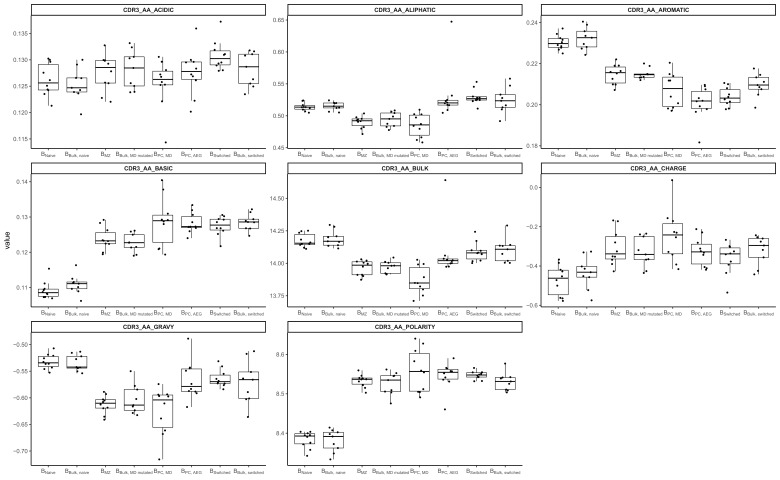
Figure 1—figure supplement 2. Comparison of CDR3 amino acid physiochemical properties in different B cell subpopulations.

Figure 1—figure supplement 2.

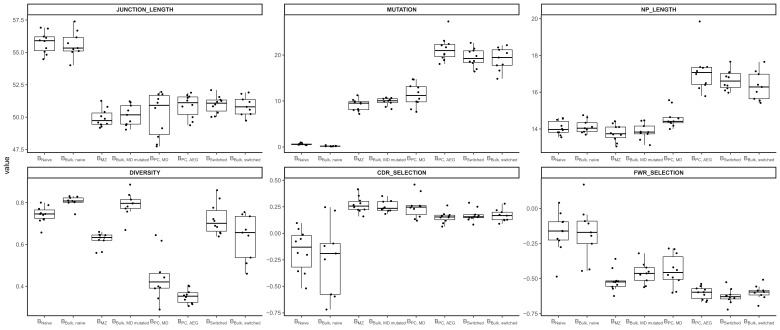
Figure 1—figure supplement 3. Comparison of global repertoire metrics in different B cell subpopulations.

Figure 1—figure supplement 3.