. 2021 Oct 18;10:e73111. doi: 10.7554/eLife.73111

Figure 4. Analysis of repertoire metrics by isotype subclass and cell type.

(A) Overview of the IgH constant region locus. Comparison of (B) mutation counts, (C) R/S ratio, (D) selection pressure, (E) junction length, (F) proportion of IGHV4-34 and (G) diversity between different B cell subpopulations. Linear discriminant analysis (LDA) fitted on (H) V family and J gene usage (see Figure 4—figure supplement 1) and (I) CDR3 amino acid physiochemical properties.

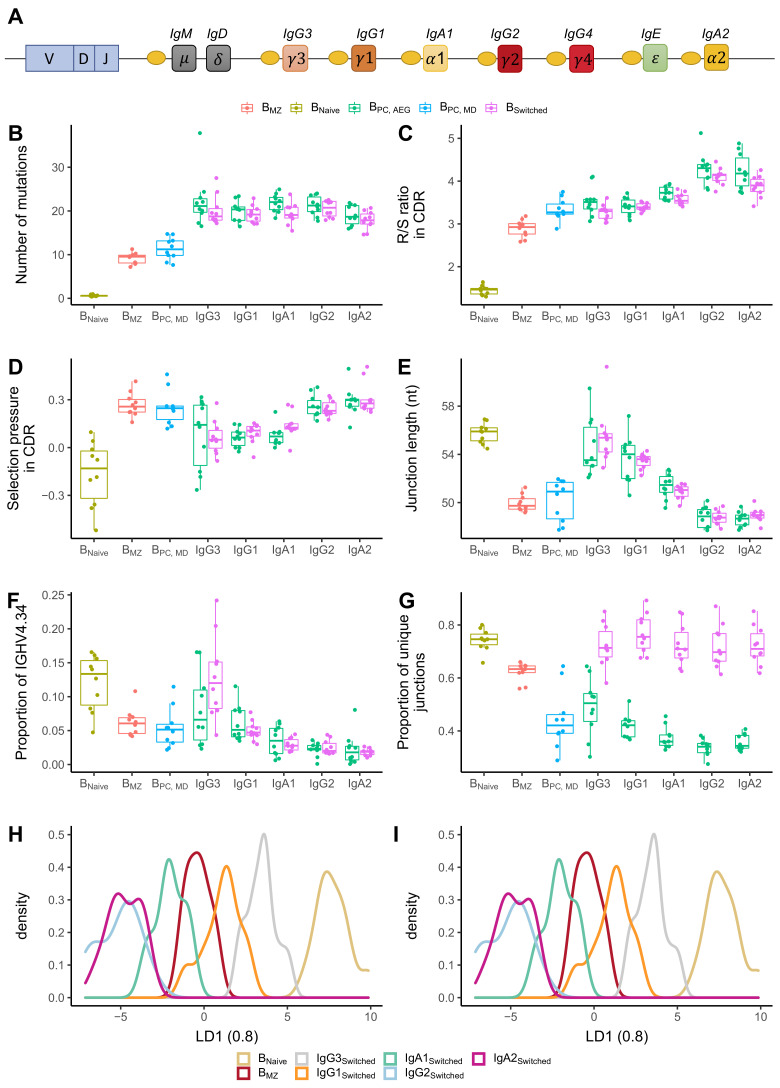
Figure 4—source data 1. Related to Figure 3 and Figure 4.

Figure 4.

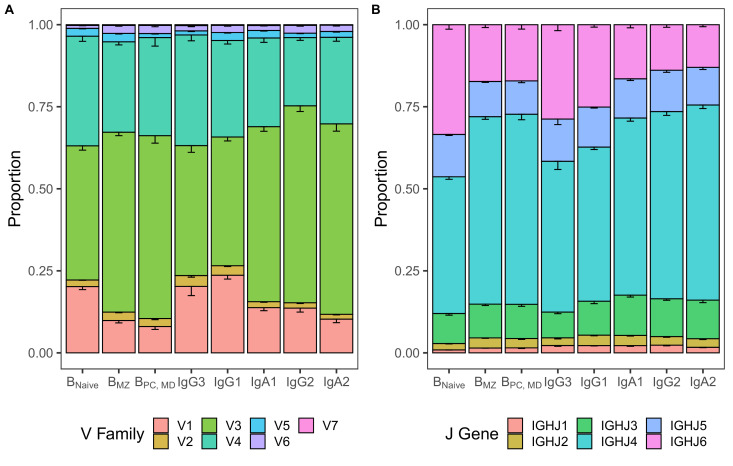
Figure 4—figure supplement 1. Differences in V and J usage across different B cell subpopulations and istotype subclasses.

Figure 4—figure supplement 1.

(A) V family and (B) J gene usage in different B cell subpopulations and isotype subclasses representing data underlying LDA in Figure 4H. Bar plots indicate the proportion of sequences with a certain gene. Error bars represent the standard error of the mean.