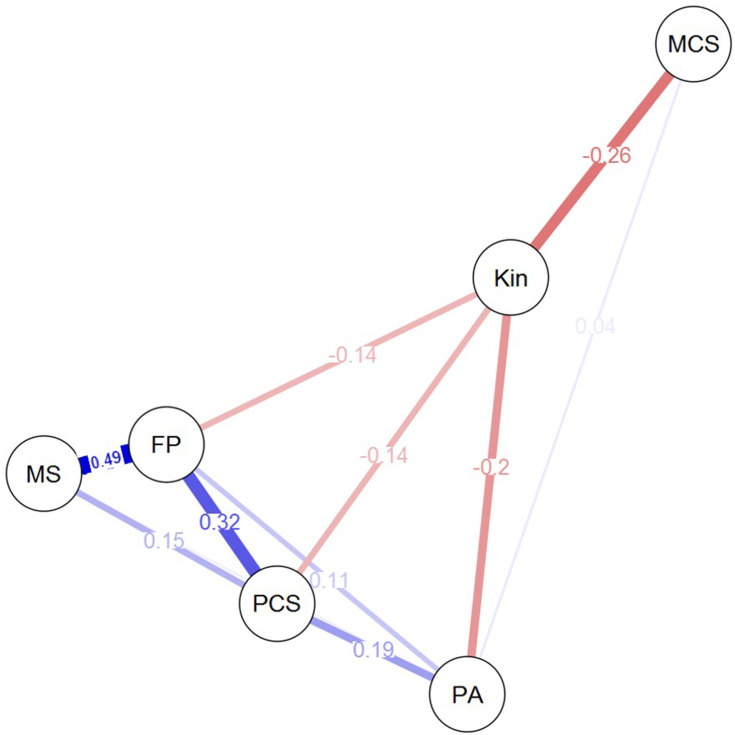
Figure 1.
Modelled network of the studied variables. Blue lines (edges) between the studied variables (nodes) represent positive partial correlations, whereas red edges represent negative partial correlations. The size and color density of the edges vary to reflect the strength of the partial correlations, with thicker and deeper blue/red-colored edges representing the stronger partial correlation coefficients. Partial correlation coefficients are indicated on their respective edge. Variables which are not graphically connected among each other are not significantly connected when controlling for other variables in the model.
Abbreviations: MCS, mental component summary; Kin, kinesiophobia; PA, weekly time spent doing PA; FP, functional performance; PCS, physical component summary; MS, muscular strength.

