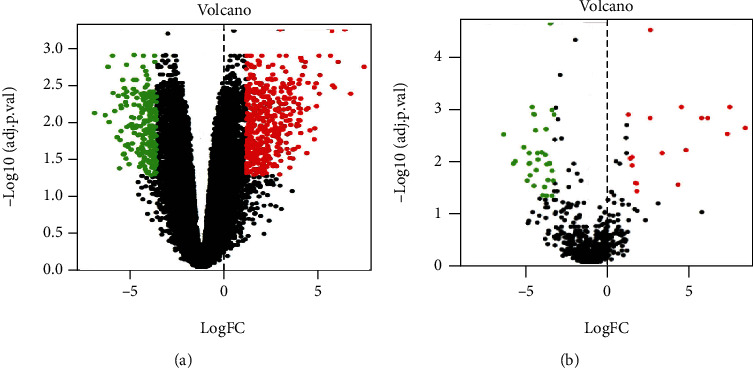
Figure 1.

Volcanic map distribution of differential expression: (a) differentially expressed miRNA map; (b) differentially expressed gene map. Horizontal axis: log2(FC); vertical axis: -log10(adj.P.Val). The FC represents the fold change in expression of tumor samples compared to normal samples, and the adj.P.Val represents the calibrated p value. Green color indicates that differential expression is downregulated; red color indicates that differential expression is upregulated.
