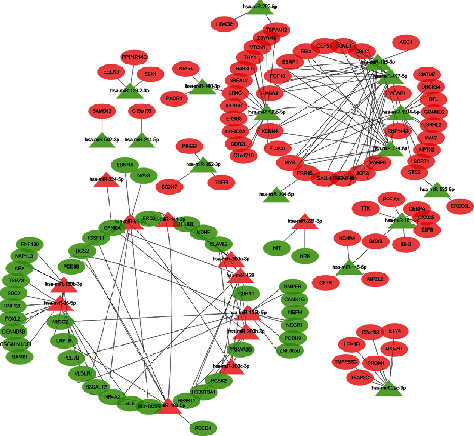
Figure 2.

The regulation network of miRNA-gene. The ovals represent differential target genes; the triangles represent differential miRNAs; the lines represent the existence of targeted regulatory relationships. The red color shows upregulation while the green color shows downregulation.
