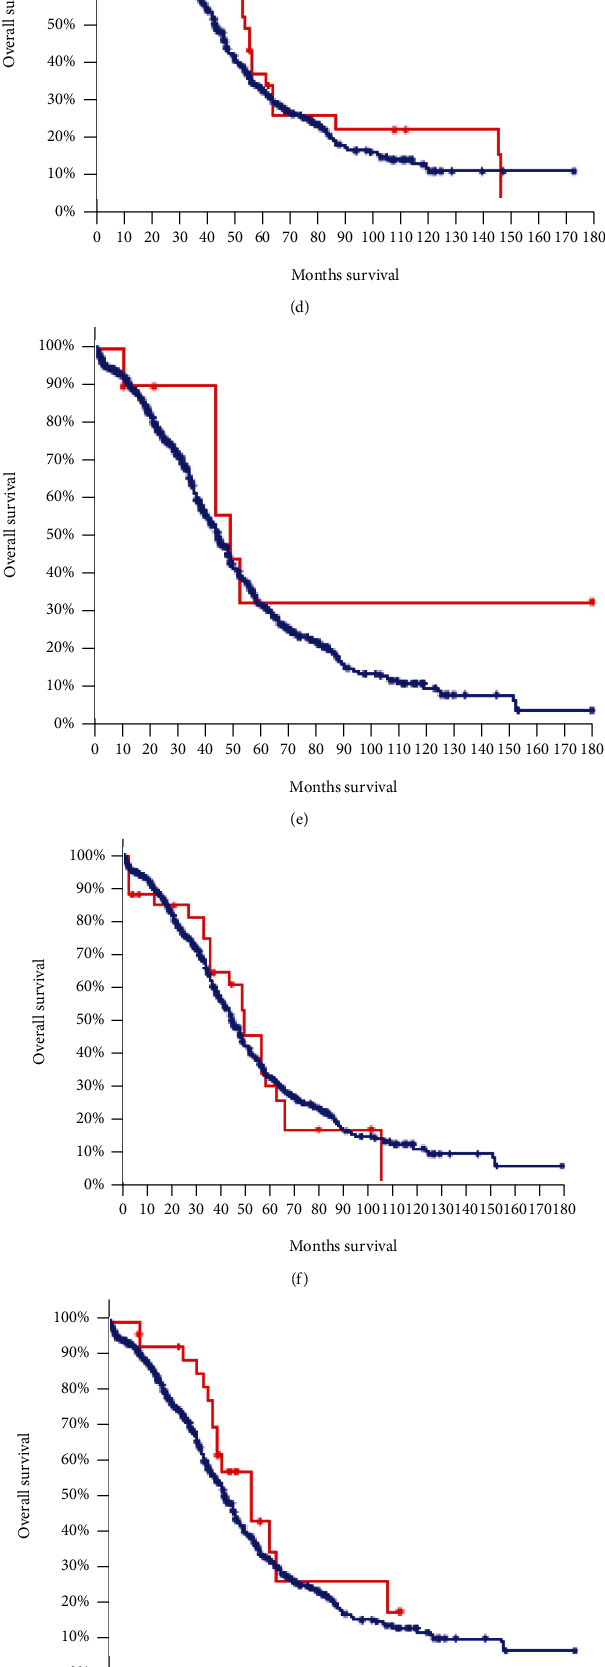
Figure 5.

Kaplan-Meier survival curve. The red represents the ovarian cancer group with target gene mutation; blue represents the ovarian cancer group without target gene mutation; p value < 0.05 is considered statistically significant.

Kaplan-Meier survival curve. The red represents the ovarian cancer group with target gene mutation; blue represents the ovarian cancer group without target gene mutation; p value < 0.05 is considered statistically significant.