
Figure 1.
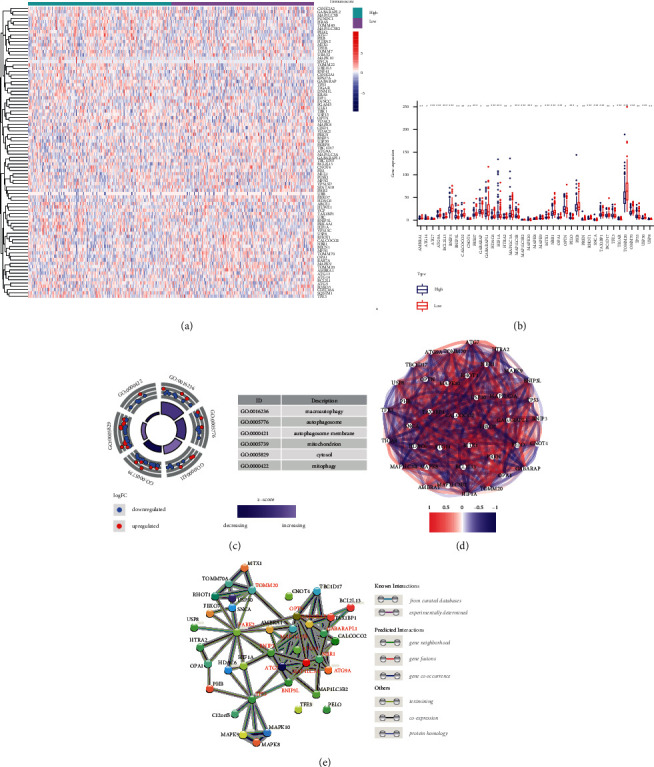
Gene expression and interaction among MRGs. (a) Gene expression profiles of the MRGs based on immunoscore classification. (b) Gene expression of 39 differentially expressed MRGs between two immune score groups. (c) GO analysis of 39 differentially expressed MRGs. (d) Correlation network of 39 differentially expressed MRGs. The strength of the relevant links to the depth of the colors. (e) PPI network encoded by 39 differentially expressed MRGs.