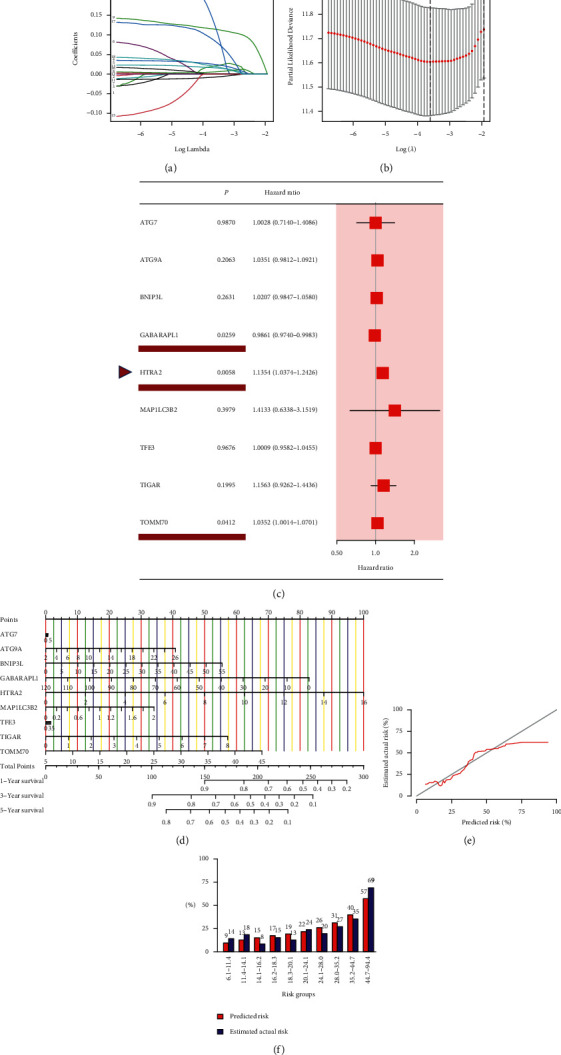
Figure 3.

Establishment of the prognosis model according to mitophagy-related gene signature in the TCGA cohort. (a) LASSO regression of the 18 mitophagy genes with the prognosis value. (b) Cross-validation for tuning the parameter selection in the LASSO regression. (c) A forest plot of 9 MRGs by multivariate Cox regression, and GABAPAPL1, HTRA2, and TOMM70 were with P < 0.05. (d) Nomogram for predicting the survival rate of HCC patients based on 9-gene signature. (e) Calibration curve of a nomogram. (f) Bar graph of predicted risk data and estimated actual risk data in each risk group.
