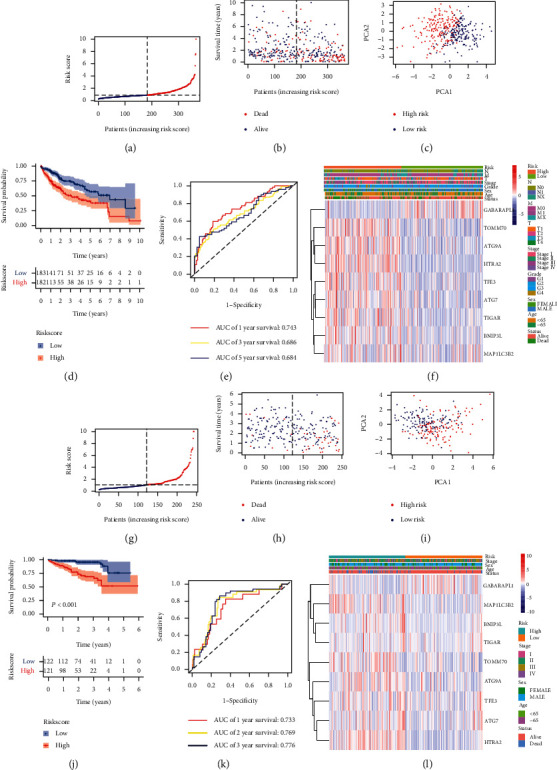
Figure 4.

Prognostic risk model in HCC patients from the training set and validation set. Distribution of HCC patients based on the risk score in the training set (a) and validation set (g). Survival time and survival outcomes for each HCC patient in the training set (b) and validation set (h). PCA plot according to the risk score in the training set (c) and validation set (i). Kaplan–Meier curves for the survival of HCC patients between two risk groups in the training set (d) and validation set (j). ROC curves of HCC patients in the training set (e) and validation set (k). Heatmap of the training set (f) and validation set (l).
