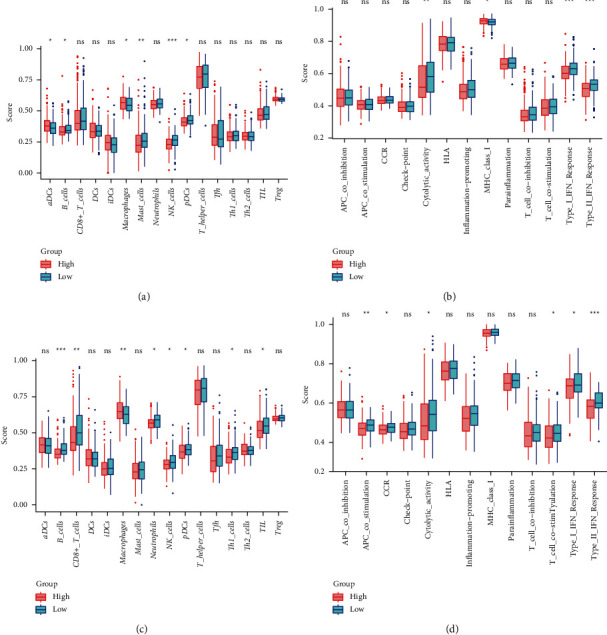
Figure 9.

The association between immune activity and two risk groups. Enrichment score of immune cells (a) and immune-related pathways (b) in the training set. Enrichment score of immune cells (c) and immune-related pathways (d) in the validation set. Red box represents the high-risk group. Green box represents the low-risk group (the below is the same). Adjusted P values: ns, not significant; ∗P < 0.05; ∗∗P < 0.01; ∗∗∗P < 0.001.
