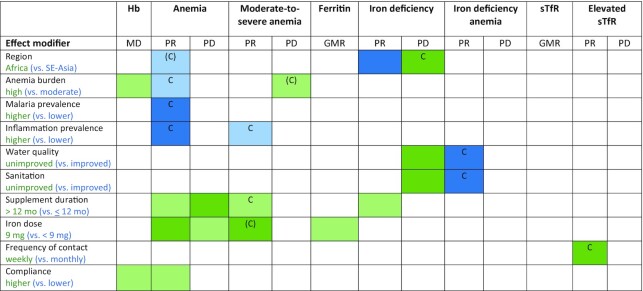
FIGURE 5.
Overview of study-level effect modification. The reference subgroup is the group expected to have the greatest potential to benefit. Green indicates a stronger effect in the reference subgroup; blue indicates a stronger effect in the opposite subgroup. Box 2 provides subgroup definitions. Dark color indicates P-interaction <0.05; light color indicates 0.05< P <0.1. The letter “C” indicates that the apparent effect modification is due to the cutoff effect; when “C” is in parentheses, it is partially explained by the cutoff effect. For iron status biomarkers (ferritin and sTfR), water quality and sanitation subgroups captured the same trials, so these characteristics are considered as a single effect modifier at the study level. Water quality and sanitation subgroups captured different trials for Hb and anemia outcomes. GMR, ratio of geometric means; Hb, hemoglobin; MD, mean difference; PD, prevalence difference; PR, prevalence ratio; sTfR, soluble transferrin receptor.

