Figure 3.

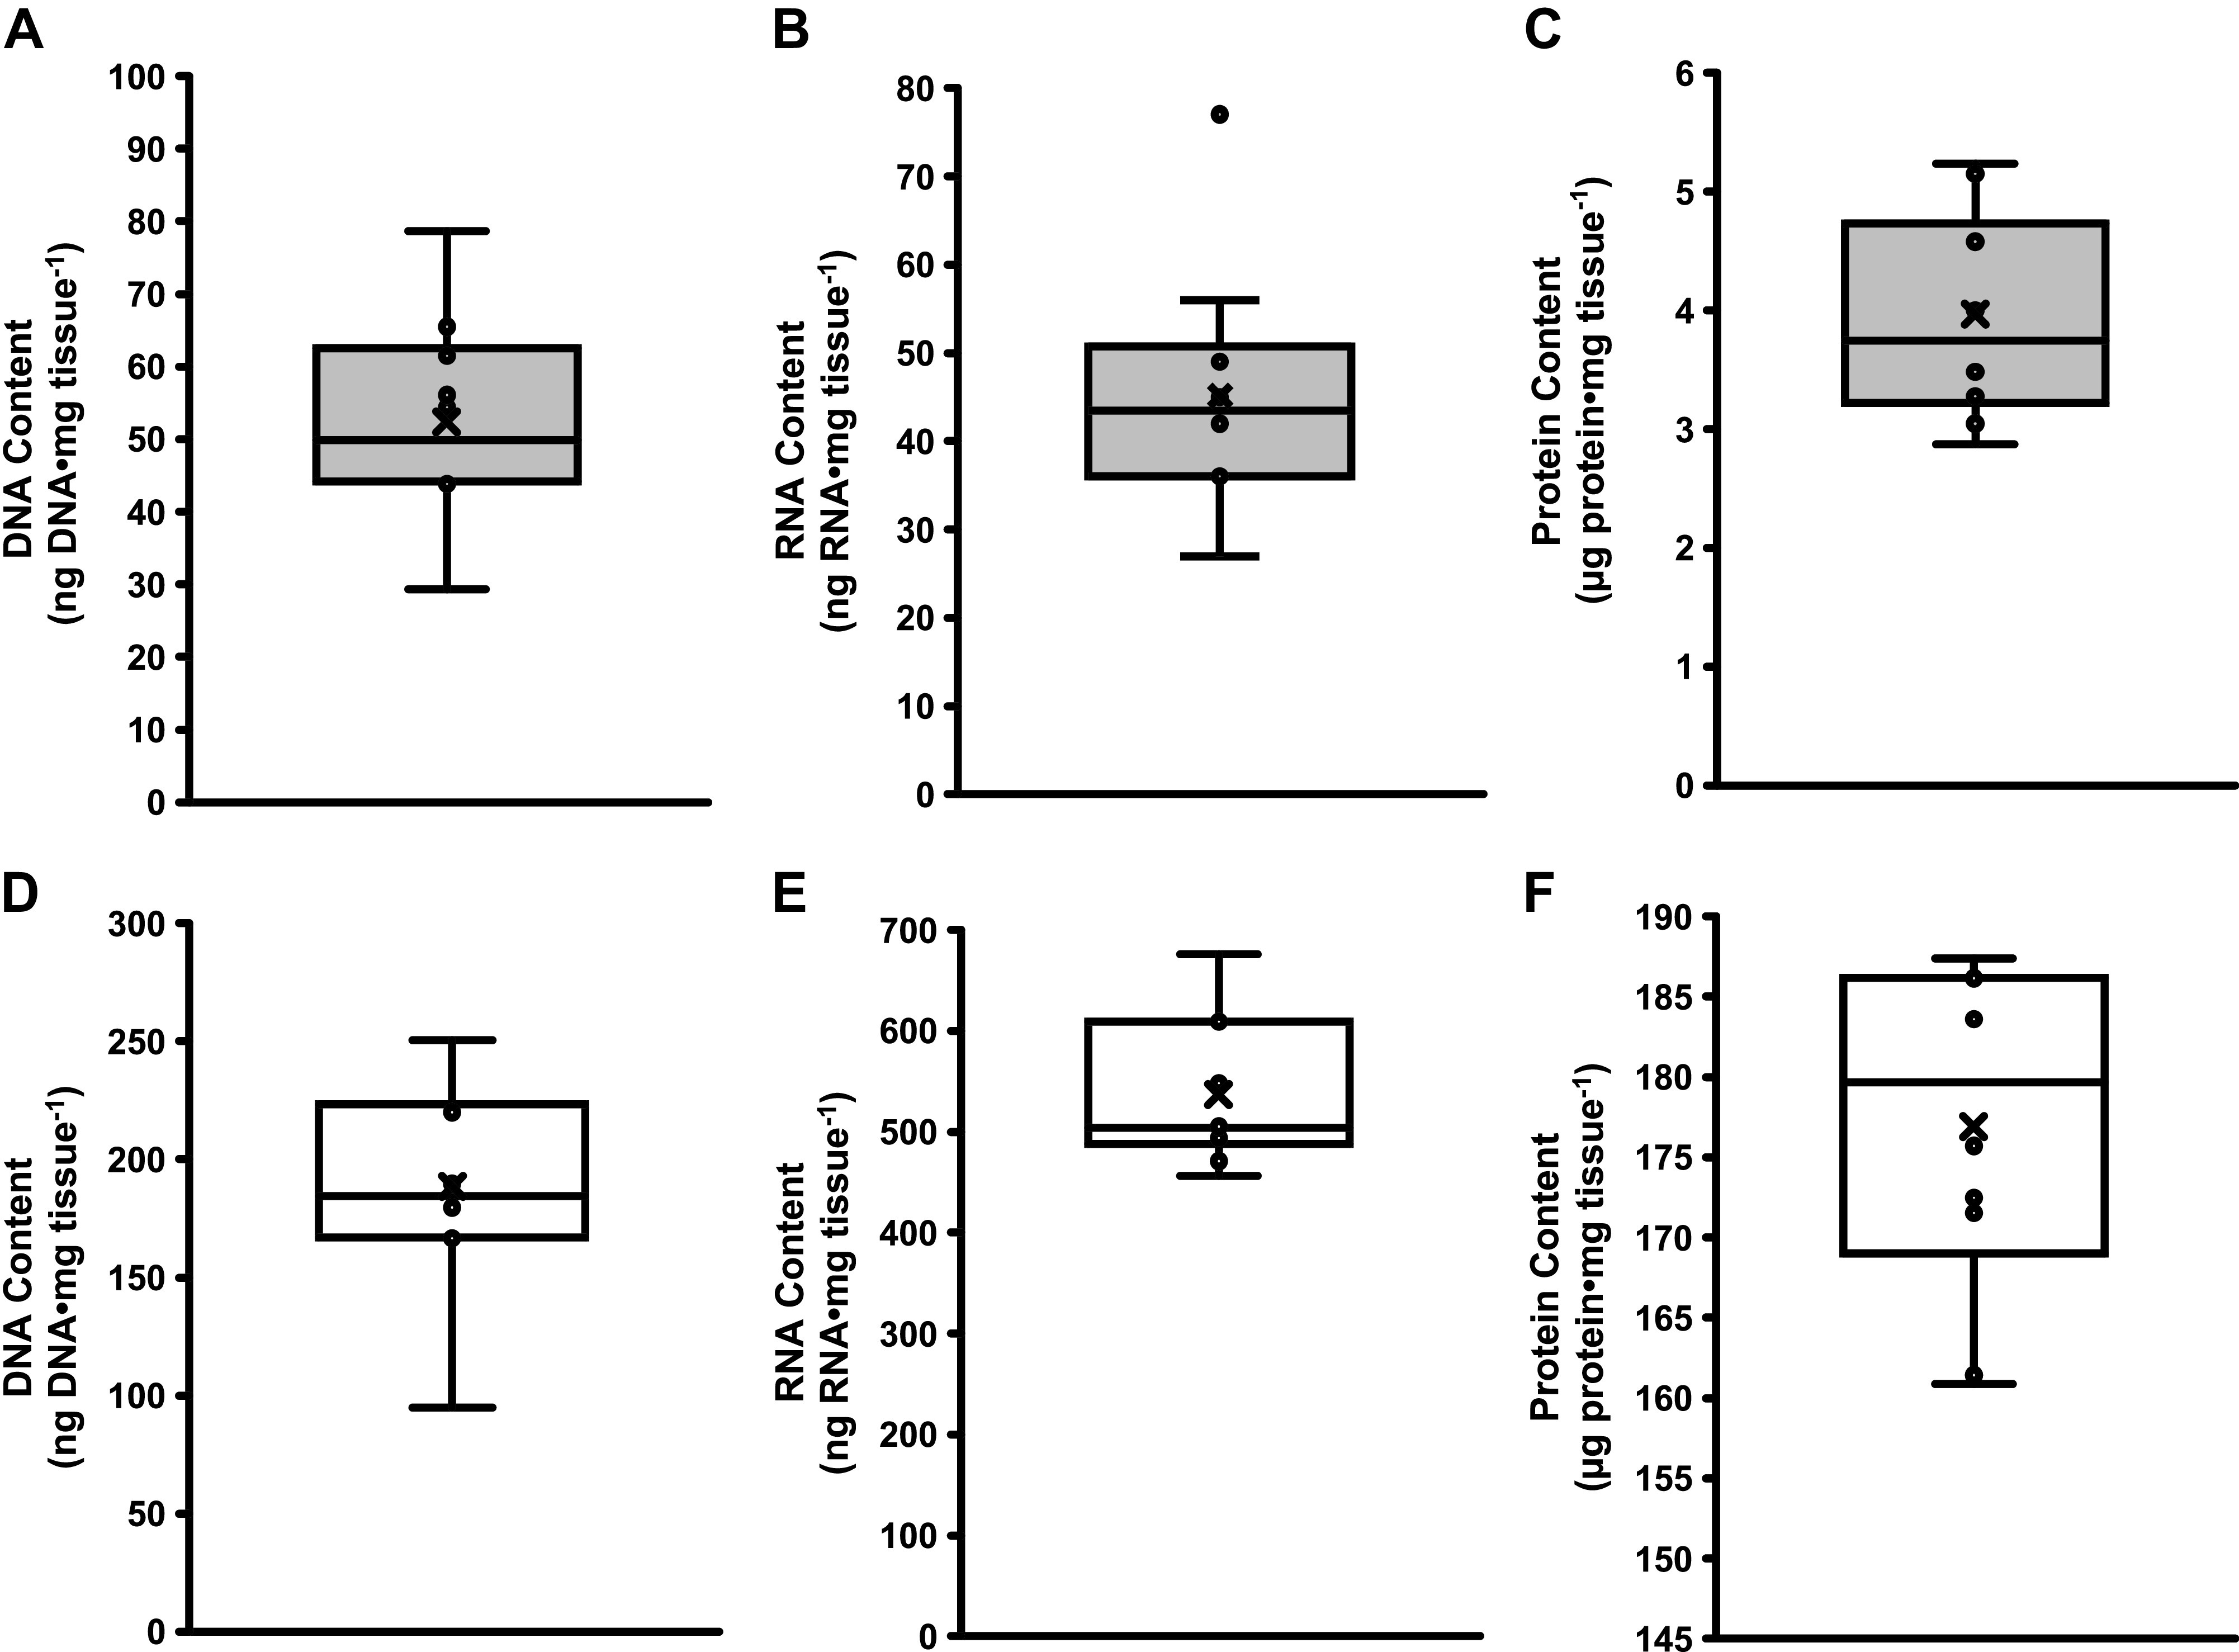
Box and whisker plots for adipose tissue (gray bars) DNA content (A), RNA content (B), and protein content (C) and skeletal muscle (open bars) DNA content (D), RNA content (E), and protein content (F).

Box and whisker plots for adipose tissue (gray bars) DNA content (A), RNA content (B), and protein content (C) and skeletal muscle (open bars) DNA content (D), RNA content (E), and protein content (F).