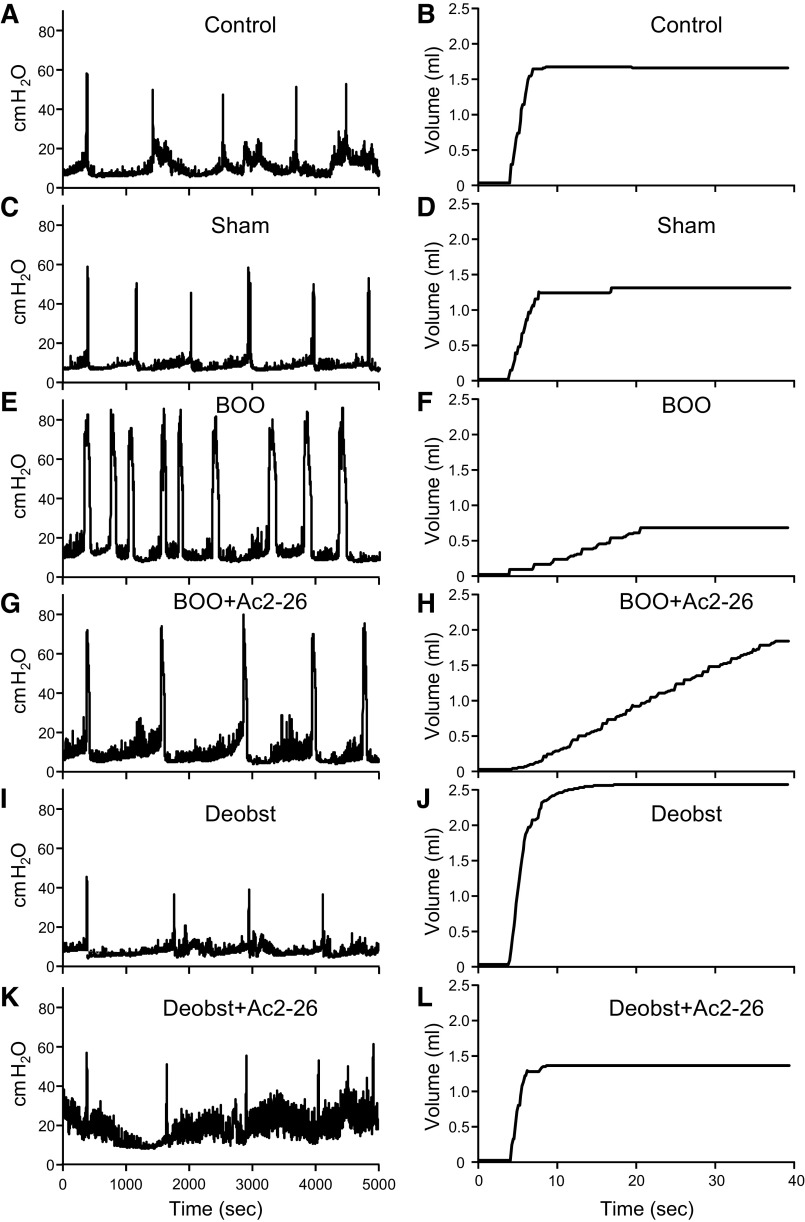
Figure 6.
Representative urodynamics pressure and scale tracings from the various experimental groups described in materials and methods. A and B: control untreated rats. C and D: sham-operated (sham) rats. E and F: rats with bladder outlet obstruction (BOO). G and H: BOO rats treated with Ac2-26. I and J: rats obstructed for 12 days and then deobstructed for 2 days (Deobs). K and L: rats obstructed for 12 days and then deobstructed and treated with Ac2-26 for 2 days. A, C, E, G, I, and K: intravesicular pressure tracings for each group through several micturition cycles. The tracing is oriented so the first peaks of voiding pressure align for ease of comparison. The tracings reveal voiding pressure and intercontraction interval, the latter of which was used to calculate frequency. B, D, F, H, J, and L: continuous tracings from the scale showing a single void recorded during urodynamics for each group. The beginnings of a void are all aligned for ease of comparison. The tracings reveal voided volume and flow rate.

