Figure 2.
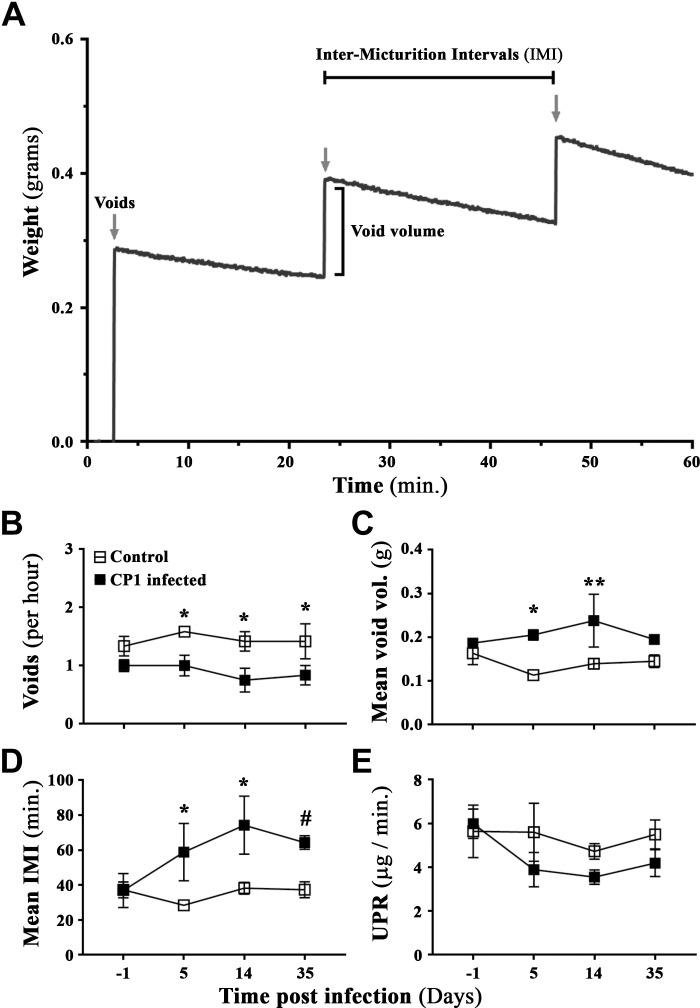
An Escherichia coli (CP1)-induced mouse model of lower urinary tract symptoms recapitulates and induces urinary dysfunction in mice. A: representative sample data graph from the Urovoid Analysis software showing voiding measurements collected using the Urovoid system and how each of the parameters were calculated. The representative data show urine volume collected in weight (g) over time (60 min). The arrows mark each individual void, the increase in weight per void is marked as void volume, and the time between each void is marked as intermicturition interval (IMI). B: average number of voids per hour over a period of 4 h. C: average volume of urine per void (calculated for each animal individually). D: average amount of time (in min) between each micturition event. E: average urine production rate (UPR) as defined as the volume of urine collected over the 4-h period of time (indicating changes in the ability to produce urine) in control and CP1-infected C57BL/6 mice a day before (day −1) and at days 5, 14, and 35 postinfection. Values are presented as means ± SE; n = 4 mice/group. #P < 0.1; *P < 0.05; **P < 0.01 (two-way ANOVA with Fisher’s least significant difference test).

