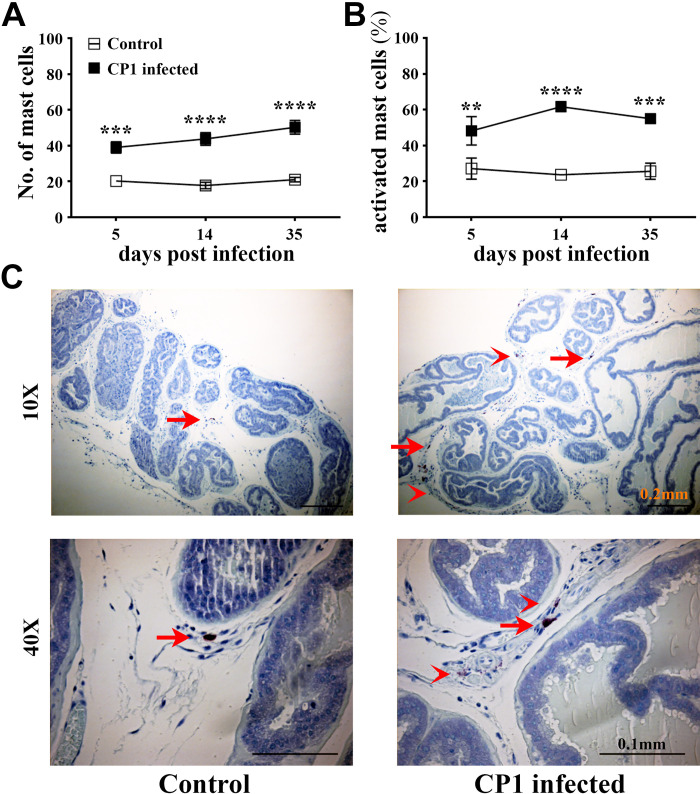
Figure 3.
CP1 infection triggers an increase in mast cell numbers and activation in the prostate of mice. A: total numbers of mast cells. B: percentage of activated (fully and partial combined) mast cells in toluidine blue-stained sections of combined mouse prostate lobes harvested at 5, 14, and 35 days post CP1 infection. Values are presented as means ± SE; n = 4 mice/group. **P < 0.01; ***P < 0.001; ****P < 0.0001 (two-way ANOVA with Fisher’s least significant difference test). Mast cell numbers and percentages of activated mast cells were determined by counting and averaging three sections of the mouse prostate stained with toluidine blue for each sample. C: representative images of toluidine blue-stained dorsolateral prostate sections from control PBS-instilled (left) and CP1-infected (right) mice at 35 days postinstillation imaged at ×10 and ×40 magnification. Note the increased degranulation of mast cells (as denoted by less intracytoplasmic granular staining of mast cells) marked by red arrowheads, whereas resting mast cells (with intact cytoplasm and membrane) are marked by red arrows.

