Figure 6.
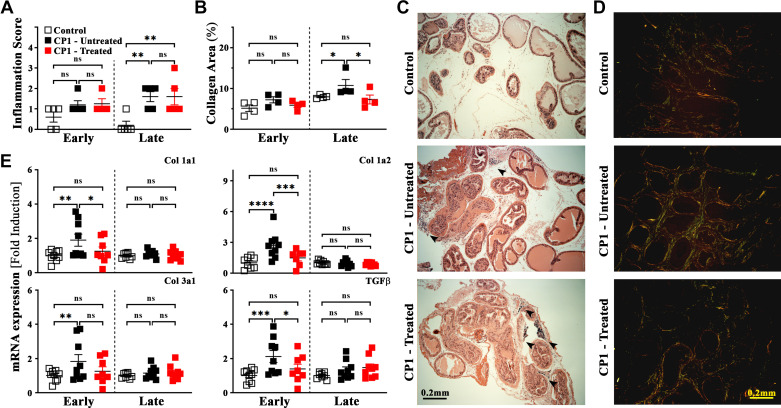
Inflammation and fibrosis are driven by mast cell activity in a CP1-induced mouse model of lower urinary tract symptoms. A and B: quantitation of inflammation scores (as described in materials and methods) using hematoxylin and eosin (H&E) staining (A) and percentages of extracellular collagen deposition as assessed by picrosirius staining (B) from sections of the dorsolateral lobe of the prostate from control, CP1-infected mice (untreated), and CP1-infected cromolyn sodium salt + cetirizine di-hydrochloride (CrS + CeHCl)-treated mice at 14 days (“early”) and 35 days (“late”) post CP1 infection. Values are presented as means ± SE. Each dot represents an individual mouse. *P < 0.05; **P < 0.01 (one-way ANOVA with Fisher’s least significant difference test). Inflammation scores and percentages of collagen area were obtained by examining three independent sections of mouse prostate lobes stained with H&E and picrosirius red staining, respectively. Quantification of picrosirius staining was performed using ImageJ software (National Institutes of Health). C and D: representative H&E-stained images (C) and picrosirius-stained images (D) of dorsolateral prostate sections from control PBS-instilled (top), CP1-infected (middle), and mast cell inhibitor-treated CP1-infected (bottom) mice at 35 days postinstillation imaged at ×4 magnification. Increased infiltration and immune cell foci are marked by black arrowheads (C). E: mRNA expression levels for profibrotic genes [collagen (Col) 1a1, 1a2, and 3a1] as well as transforming growth factor-β (TGF-β) were examined from RNA isolated from total prostates of mice from control, CP1-infected mice, and CP1-infected CrS + CeHCl-treated mice at 14 days (early) and 35 days (late) post CP1 infection. RNA was isolated, converted to cDNA, and subjected to real-time PCR analysis with the respective gene primers. mRNA expression levels were normalized to GAPDH mRNA levels for each sample, and the data are presented as fold changes over control. Values are presented as means ± SE. Each dot represents an individual mouse. *P < 0.05; **P < 0.01; ***P < 0.001; ****P < 0.0001 (one-way ANOVA with Fisher’s least significant difference test). ns, not significant.

