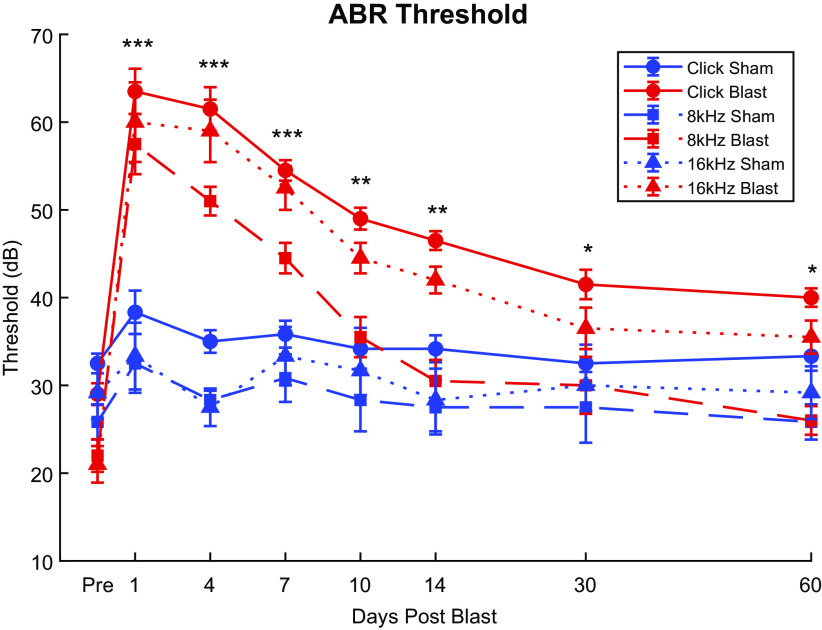
Figure 2.
Auditory brainstem response (ABR) threshold changes of Blast (n = 10) and Sham (n = 6) rats during the first 2 mo postexposure. Blast animals demonstrated drastic increases (worse) of Click, 8-kHz, and 16-kHz thresholds (red lines) postexposure as opposed to Sham animals (blue lines). Significant main effects (P ≤ 0.001) of Groups and Group × Time interactions were observed in all carriers. Significant Simple Main Effect of single time points observed in various carriers throughout the 2 mo. For subsequent figures, red lines will denote blast-exposed animals, and blue lines will denote sham-exposed animals. Asterisks indicate time points where significant Simple Main Effects of Group as demonstrated in Supplemental Table S1: see https://doi.org/10.6084/m9.figshare.16527966. ***Blast threshold significantly higher than Sham in Click, 8 kHz, and 16 kHz, P < 0.05; **blast threshold significantly higher only in Click and 16 kHz; *blast threshold significantly higher only in Click.

