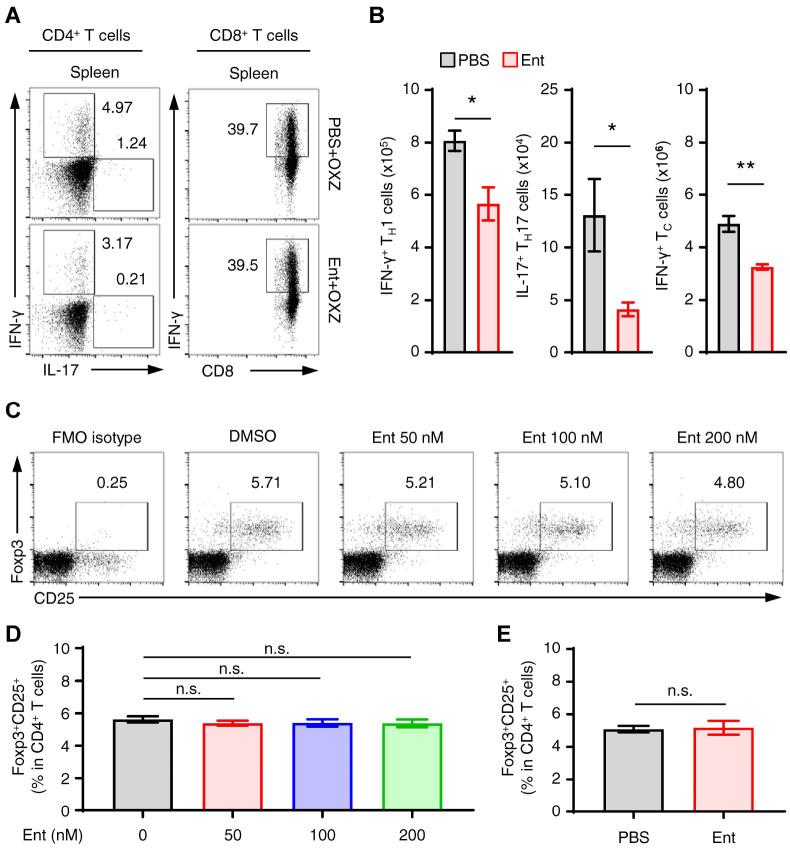
Fig. 3.
The population changes of effector and regulatory T cells by entinostat in CHS mice. (A) Representative dot plot images show splenic IFN-γ+CD3+CD4+ (Th1), IL-17+CD3+CD4+ (Th17) T cells, or IFN-γ+CD3+CD8+ (cytotoxic T cells) T cells in mice with or without entinostat. (B) The histograms show the numbers of subsets in each T cell for panel A. (C, D) Splenocytes (3 × 10⁶) were incubated in PIB with or without entinostat (0-200 nM) for 4 h. Representative dot plot images (C) and frequencies (D) of splenic Foxp3+ CD25+ (Treg) cells in CD4+ T cells are shown. (E) The frequencies of Foxp3+ CD25+ Treg cells in spleen from CHS mice with or without entinostat treatment were analyzed by flow cytometry. Representative images (A, C) or all values are shown as the mean ± SEM (B, D, E) from at least three independent experiments. *P < 0.05, **P < 0.01, n.s., not significant by Student’s t-test. Ent, entinostat. OXZ, oxazolone.

