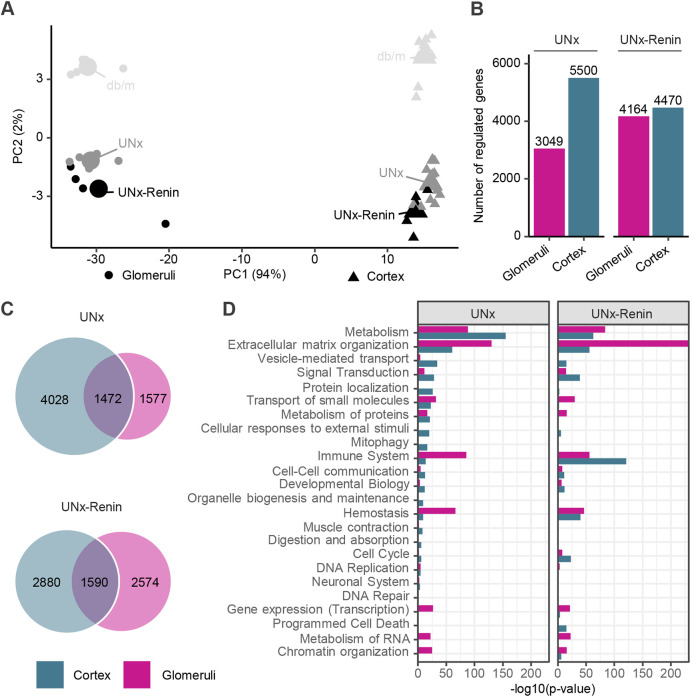
Fig. 3.
Highly specific gene expression profiles in glomeruli versus cortex for UNx and UNx-Renin mice compared to db/m controls. (A) PCA of the 500 most variable genes. Small points indicate a sample and large points the group centre. (B) Total number of DEGs in glomeruli and kidney cortex from UNx and UNx-Renin mice compared with db/m controls. (C) Venn diagrams depicting shared and separate DEGs in glomeruli and kidney cortex from UNx or UNx-Renin mice. (D) Reactome pathway gene enrichment analysis in glomeruli and kidney cortex from UNx or UNx-Renin mice. Degree of perturbation is presented as the −log10(P-value) after correction for gene-wise multiple testing (n=5-13).

