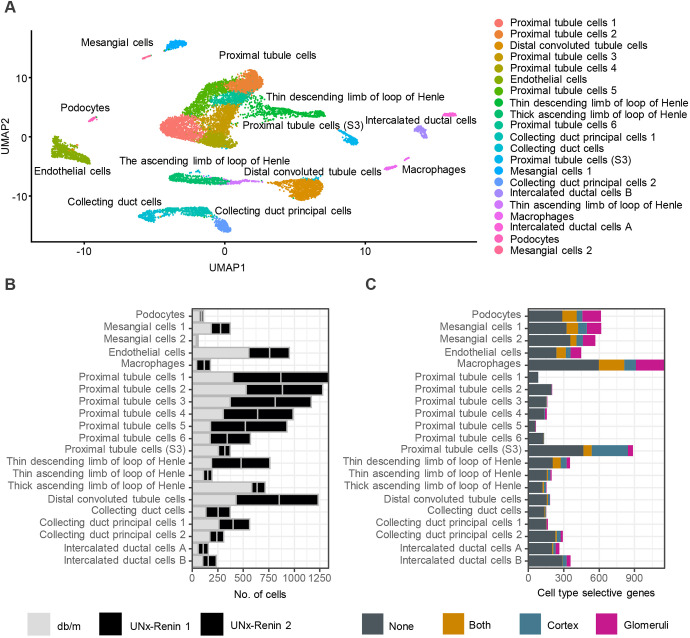
Fig. 4.
Number of DEGs in cortex and glomeruli of UNx-Renin mice mapped to a specific cell type using snRNAseq. (A) UMAP of 12,840 nuclei from mainly kidney cortex of db/m and UNx-Renin mice (n=1-2). Each dot represents a nucleus coming from a single cell. Cells that show similar transcriptomic profiles are grouped by colour based on unsupervised clustering. A total of 21 cell populations were identified. (B) Number of cells found in each cell population per animal. (C) Number of cell type-specific genes significantly regulated between UNx-Renin and db/m mice in glomeruli, cortex, both or none of the two tissue areas. Genes were defined as specific to a cell population if the expression was increased by twofold compared to the cell population with the second highest expression level.

