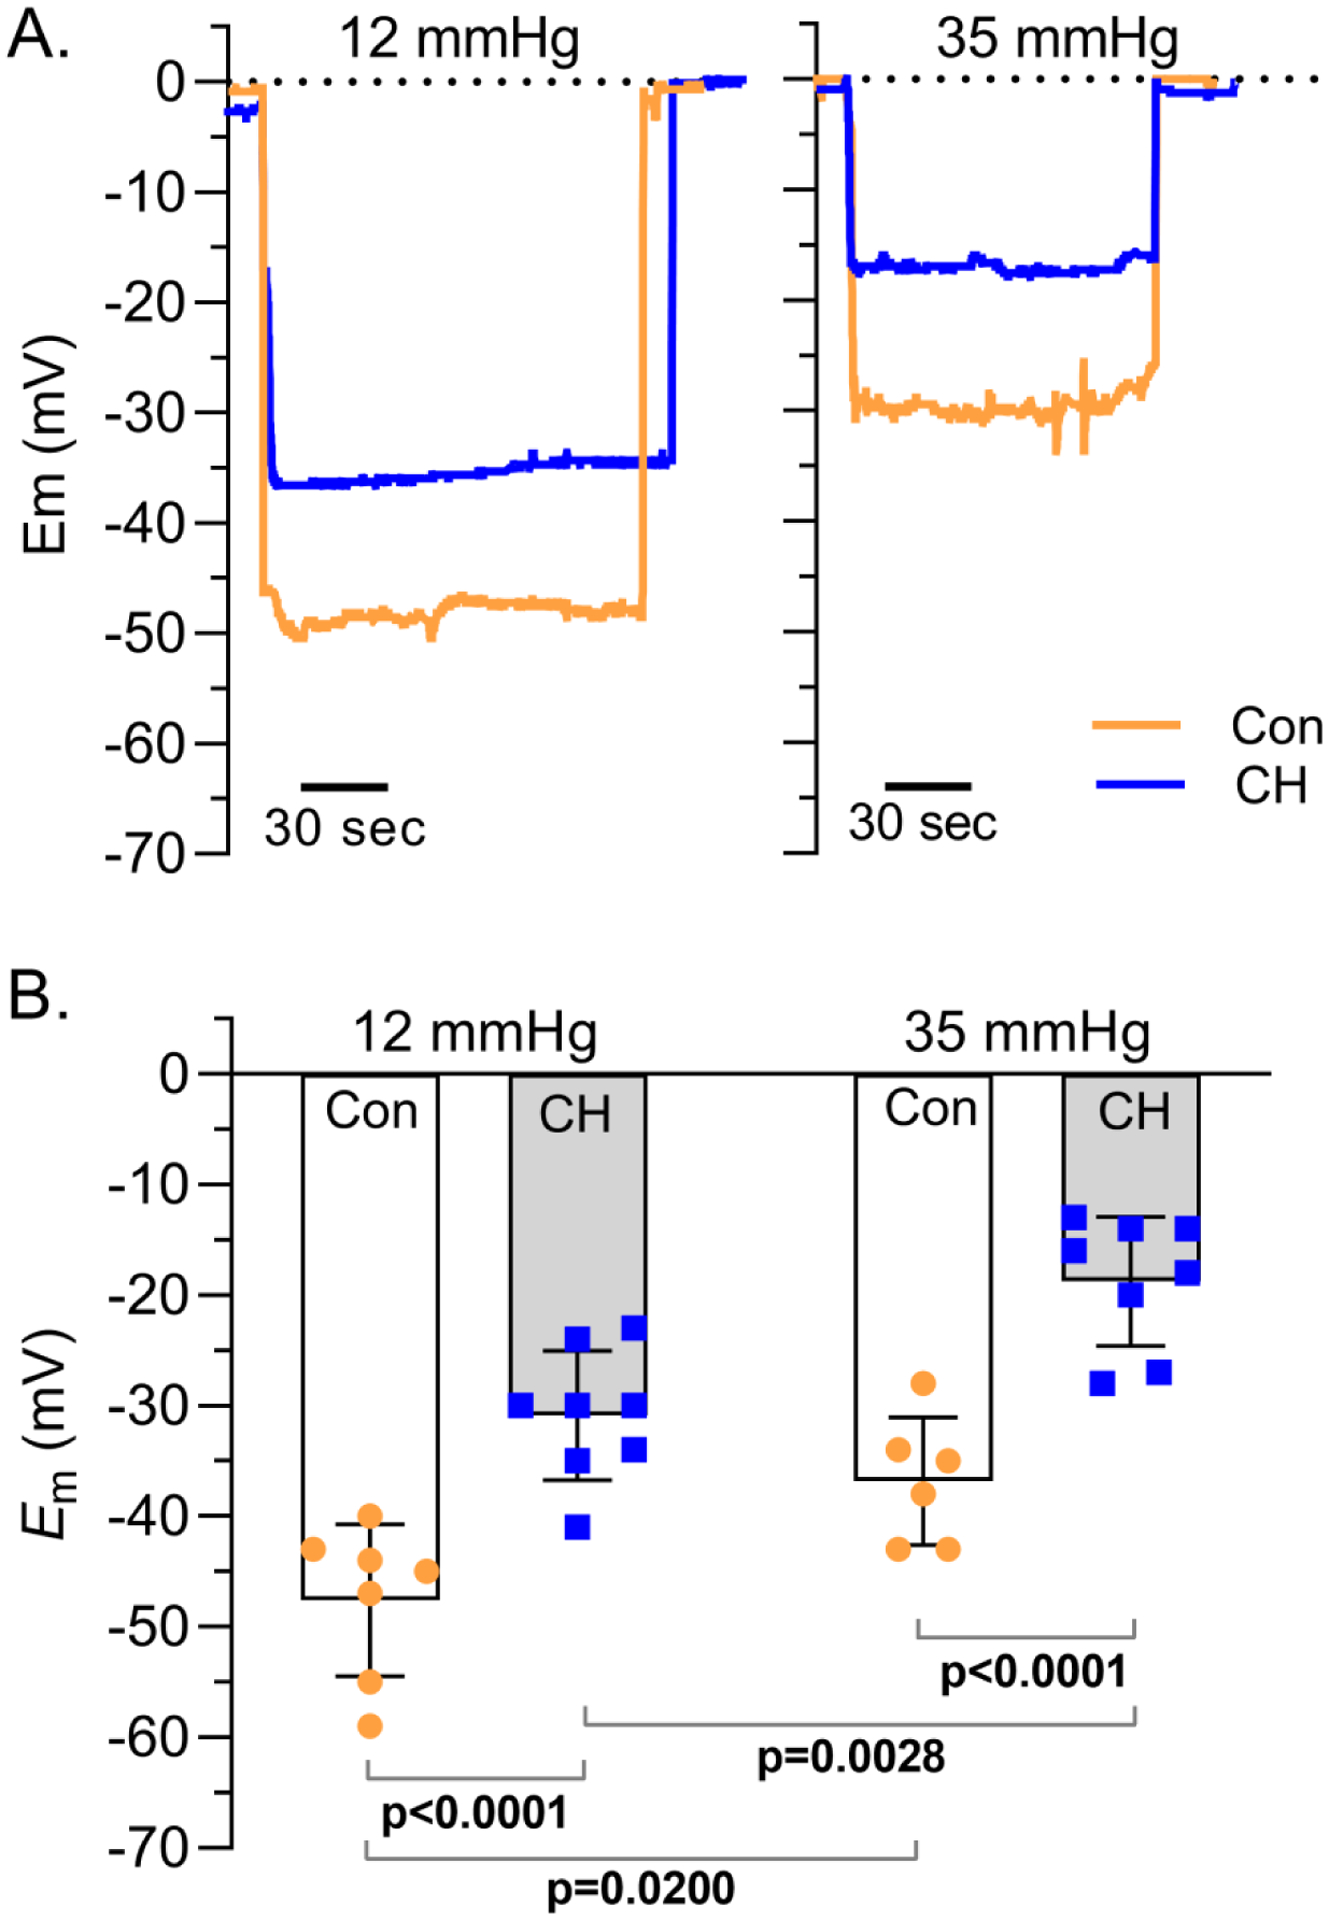
Figure 1. CH-induced PASMC Em depolarization is independent of intraluminal pressure.

A) Representative traces and B) summary data showing PASMC membrane potential (Em; mV) in isolated small pulmonary arteries from control (circles) and CH (squares) rats pressurized to 12 (left) or 35 (right) mmHg. Values are means (SD); dots indicate n as # of animals/group; analyzed by two-way ANOVA, individual groups compared using Tukey’s multiple comparisons test.
