
Fig. 6:
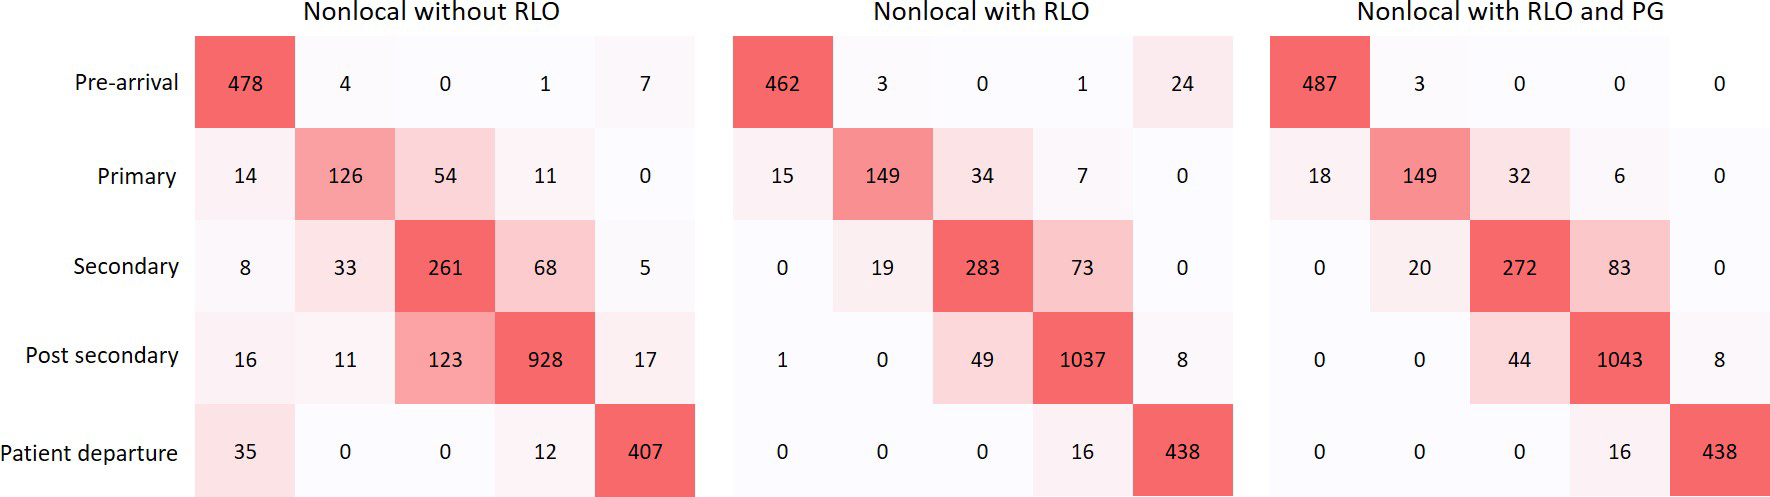
Confusion matrices for phase recognition using nonlocal network. The values in the confusion matrices denote the number of input clips across the 33 testing cases. The left diagram is the confusion matrices using nonlocal network without RLO and PG, the middle diagram is the confusion matrices using nonlocal network with RLO only, and the right diagram is the confusion matrices with both RLO and PG.